Beta
Graph Visualization SDK
Draw the graph. Then watch the algorithm run on it.
A graph and data visualisation SDK with a Rust/WASM core, three renderers that pick themselves, and 77 chart types, open source at the core.
KeyLines / ReGraph alternative
TESSERA VIZ · ALGORITHM PLAYBACK
26
Algorithms with playback
3
Renderers, auto-routed
Built for
Teams building graph UIs
Fraud and security analysts
People who teach algorithms
Anyone pricing KeyLines
What it solves
The problem, and what changes.
Before
With Tessera Viz
01
The enterprise graph suite costs more than the engineer building the UI.
The engine is Apache-2.0 and free, up to 500k nodes on WebGL.
02
An algorithm gives an answer, and nobody can show an investigator how it got there.
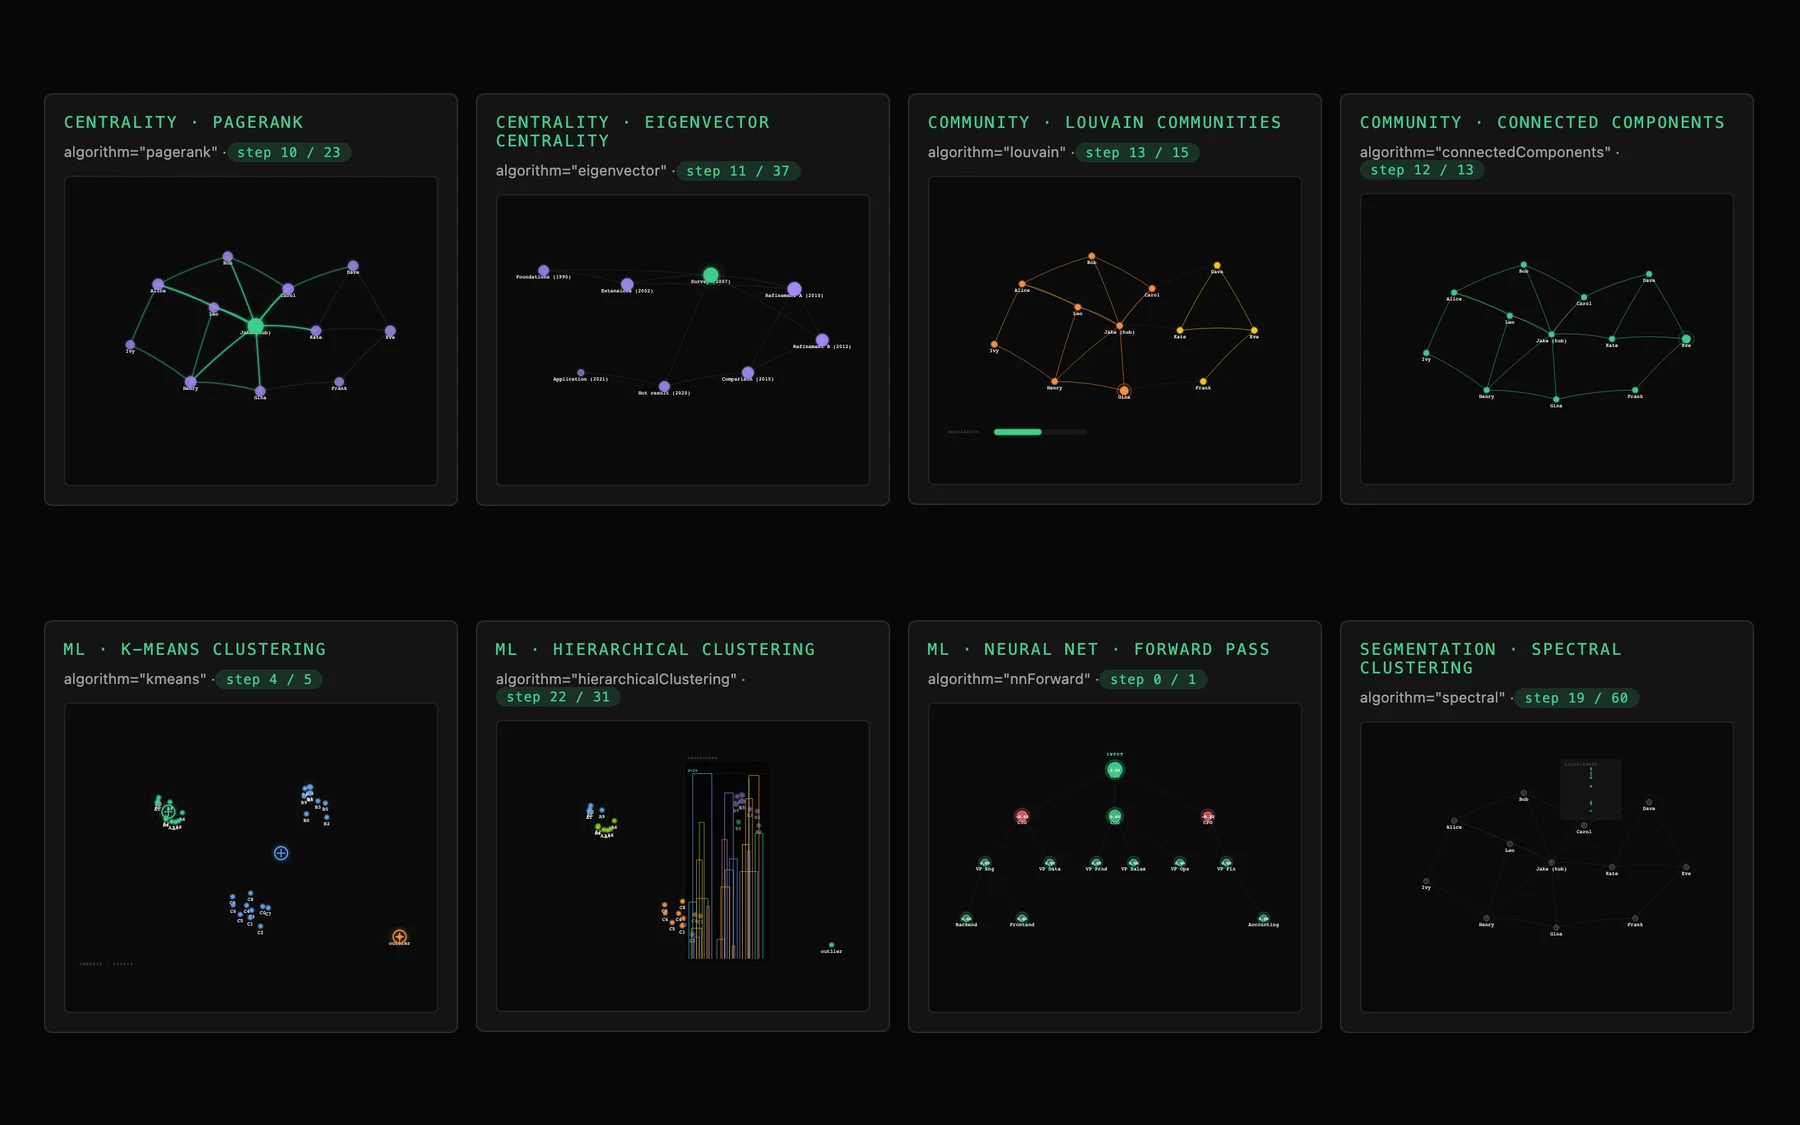
26 algorithms played back a frame at a time, from PageRank to attention.
03
A graph library, a chart library and an export library, each with its own theme.
Graphs and 77 chart types in one package, with one theme system and one export path.
The pipeline
Five stages. You decide the ends.
You choose what goes in and what comes out. In between, Tessera Viz reads the format, explains what is wrong with the graph, runs the algorithm a step at a time and picks the renderer the size of the job calls for.
← Swipe for the whole diagram →
Why it's different
The short case for Tessera Viz.
01
26
Algorithms with playback
Scrub PageRank, Louvain, K-means or attention a step at a time.
02
3
Renderers, auto-routed
SVG, Canvas or WebGL, picked by the size of the job.
03
77
Chart types
Sankey to candlestick, in the same package as the graph engine.
04
49 kB
Core, gzipped
Held there by a size guard in CI.
See it
What it draws, board by board.
06 SCREENS · CLICKTAP TO ENLARGE
Tessera Viz
01 / 06
01
Algorithm playback
Eight of the twenty-six, each mid-playback with its own step counter.
Community
$0
forever
Studio
$29
per developer / month
Enterprise
$9,900
per year
Regulated
$39,000+
per year