Tessera Viz
PX-02
Life sciences
Pathways, interactions, and lineage.
Two of the twenty layouts exist because this work asked for them. A metabolic pathway is not a force-directed graph that happens to be biological, and a kinship tree is not a dendrogram.
What this work asked for.
Layouts that exist for this
Metabolic pathway and kinship tree are in the twenty because this work asked for them. So is dendrogram, for hierarchical clustering results you need to show rather than describe.
Protein interaction networks
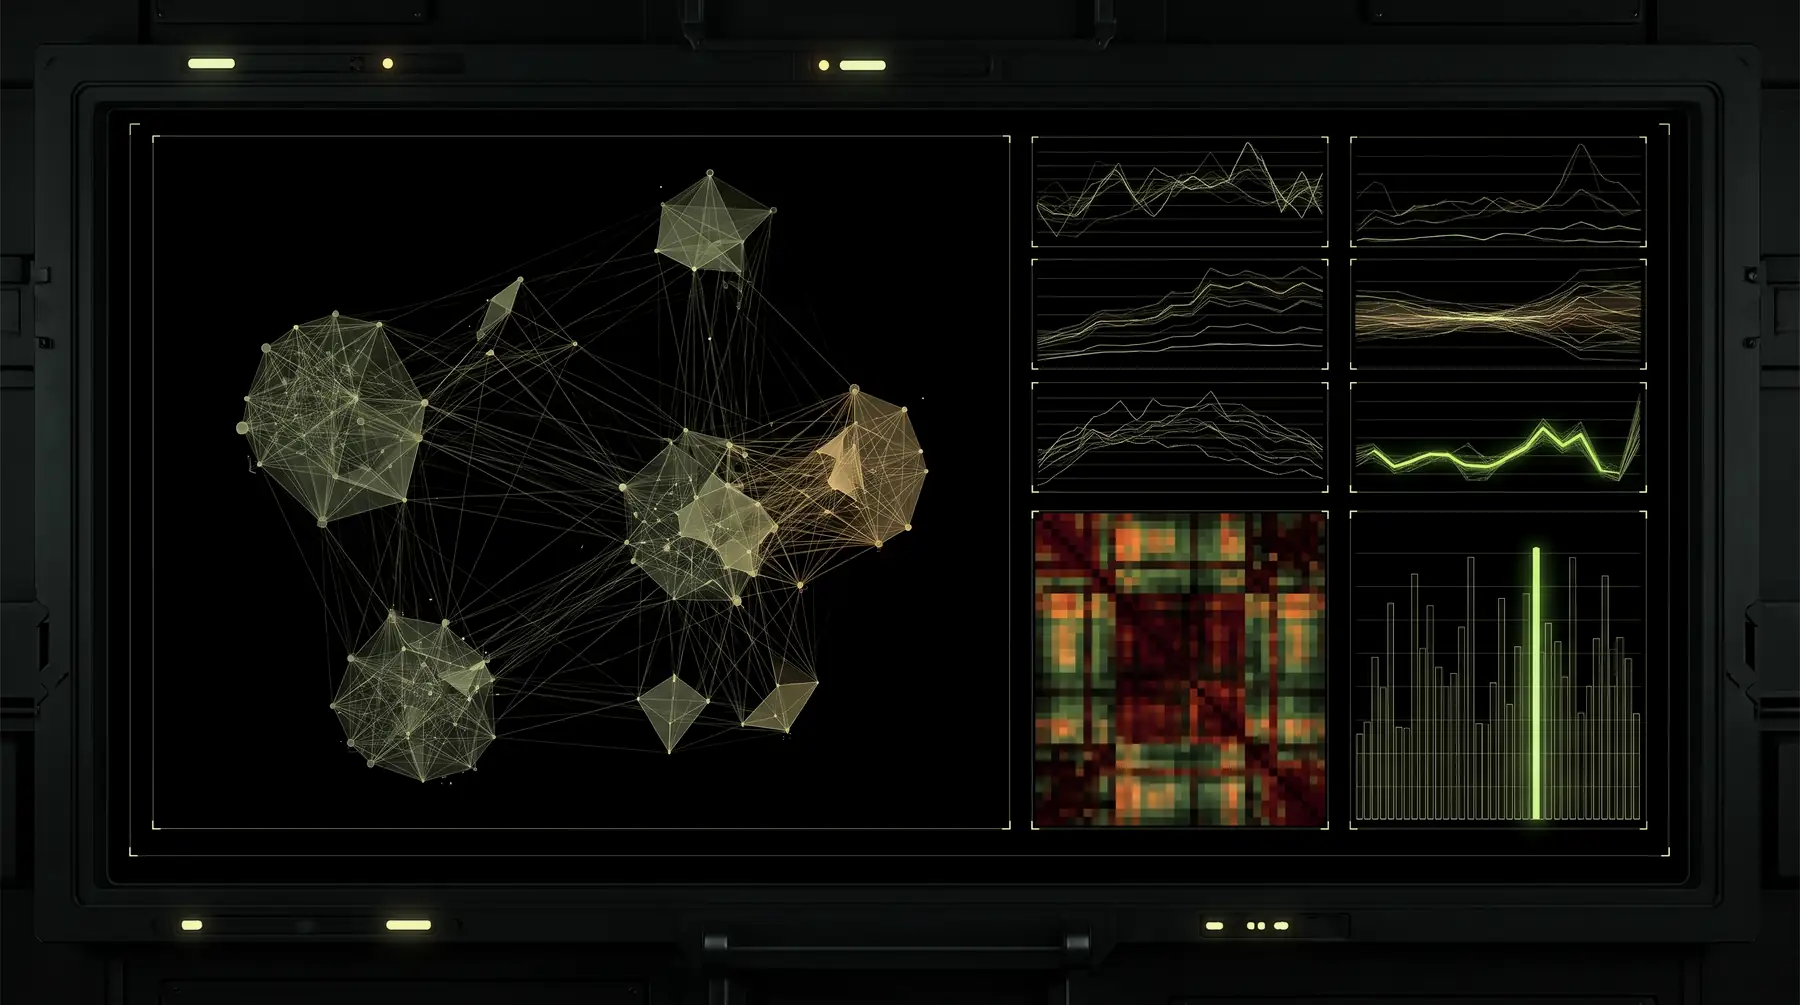
Dense, undirected and large. Community detection over them, with the result driving colour and size directly rather than being written back to a server and re-fetched.
Clinical timelines
Events and continuous measures on the same axis, one track per subject, with aggregation from seconds to years.
Lineage
Kinship trees where the relationship has a direction and a generation, drawn as a tree rather than settled by a force.
An honest limit
Charts here are presentation, not analysis. There is no statistical modelling and no forecasting — compute the numbers, and hand us the numbers.