Tessera Viz
PX-02
Thirty-one of them
Show me the thing I came for.
A gallery answers "what can it draw". This answers "can it do the thing I am here about" — filtered by the surface you need or the discipline you work in, with each entry naming the technique rather than the picture.
Filter by what you need.
31 OF 31
Surface
Discipline
Linked
· Financial crime
· Cyber security
· Intelligence
One dataset, five views, linked
Select an account in the graph and the timeline shows its transfers, the map shows its counterparties and the grid scrolls to its rows. One selection model across four surfaces, with no synchronising code in between.
Graph
· Financial crime
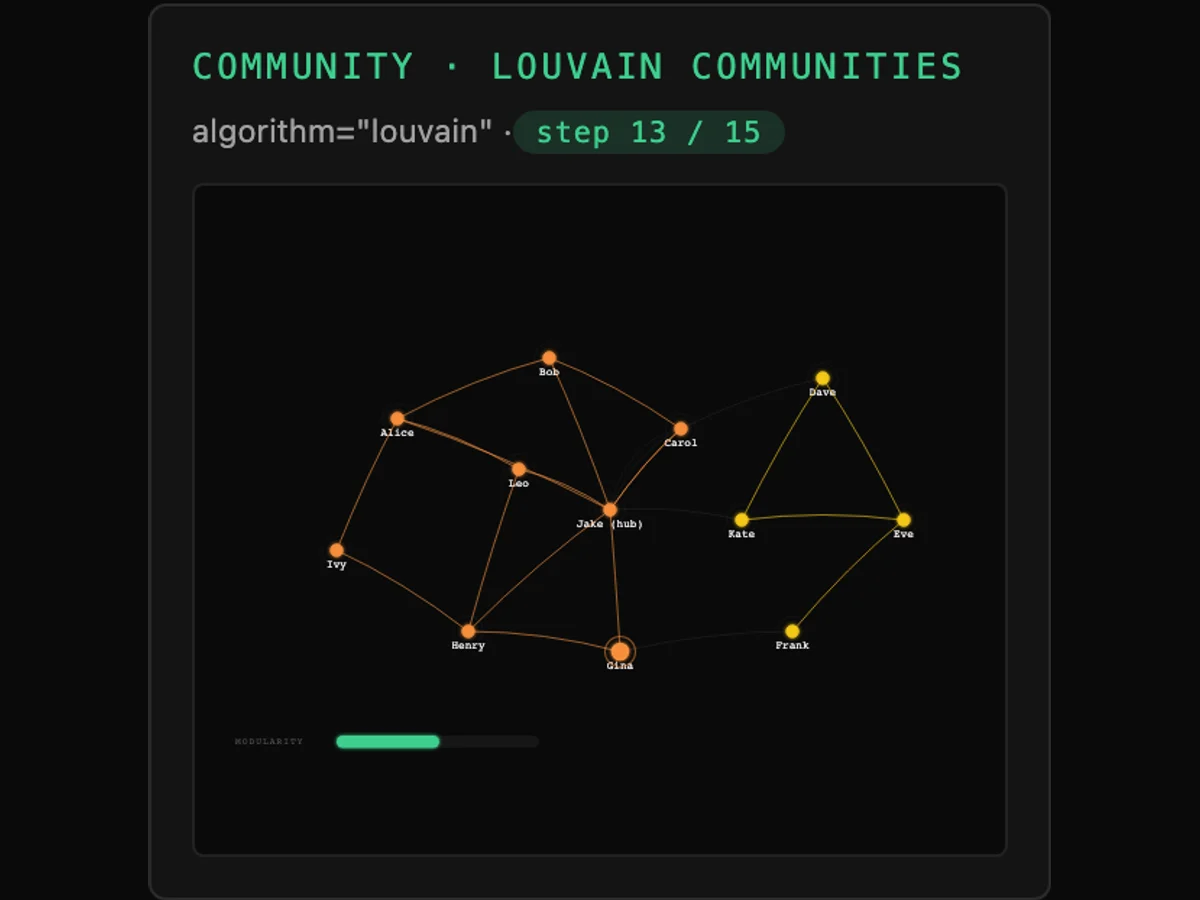
Community detection over a payments network
Louvain over the transfer graph, with the community driving colour. A structuring ring is a cluster that moves money between its own members more than it moves it anywhere else, and the clustering finds it before anyone writes a rule for it.
Graph
· Financial crime
· Cyber security
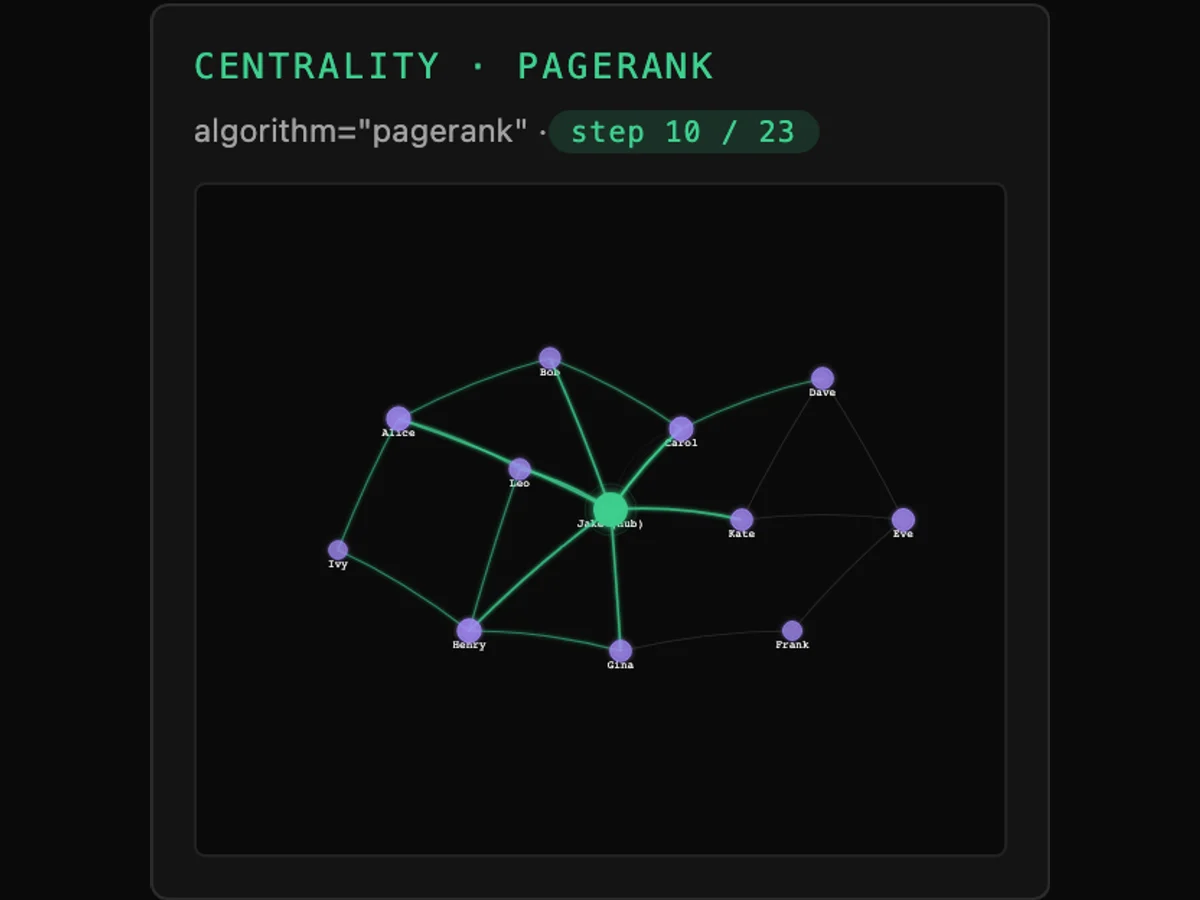
Betweenness, to find the intermediaries
Centrality ranked and mapped straight onto node size. The account that sits on the path between two clusters gets bigger, which is the one worth a subpoena.
Graph
· Financial crime
Min-cut on a layering chain
The smallest set of transfers whose removal disconnects the source from the destination — the chokepoint, found rather than argued about.
Graph
· Financial crime
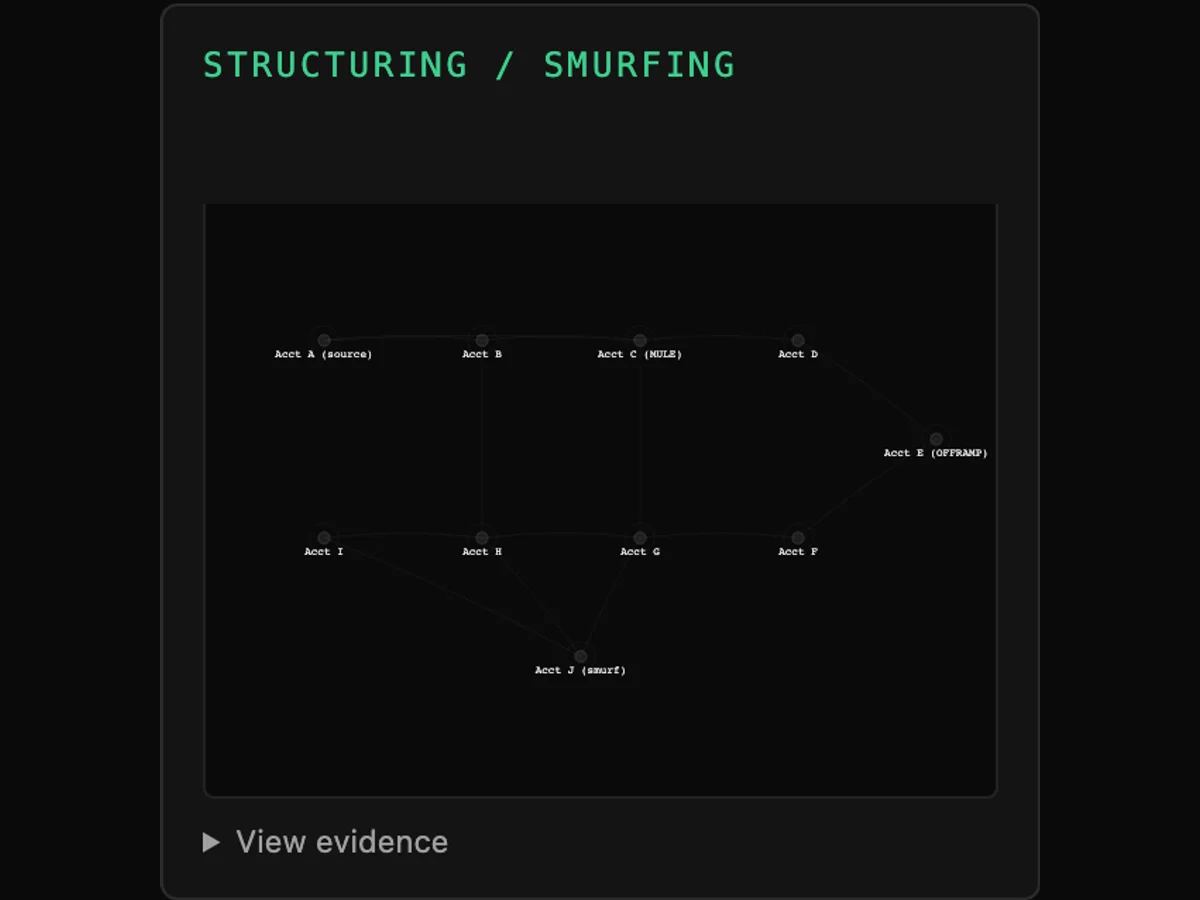
Money mule and structuring detectors
Six domain detectors over the same graph: mule accounts, structuring, velocity, cycles, beneficiary chains and an aggregate score. Part of the finance domain pack.
Graph
· Cyber security
Shortest path across an asset graph
Given an entry point and a crown-jewel asset, the route between them. The path is the thing to break, and it is a query rather than a meeting.
Graph
· Cyber security
Attack paths at WebGL scale
An enterprise asset graph is a WebGL graph. Same API, same layouts and same events as the thousand-node view the analyst started on — only the renderer changed.
Graph
· Financial crime
· Cyber security
· Life sciences
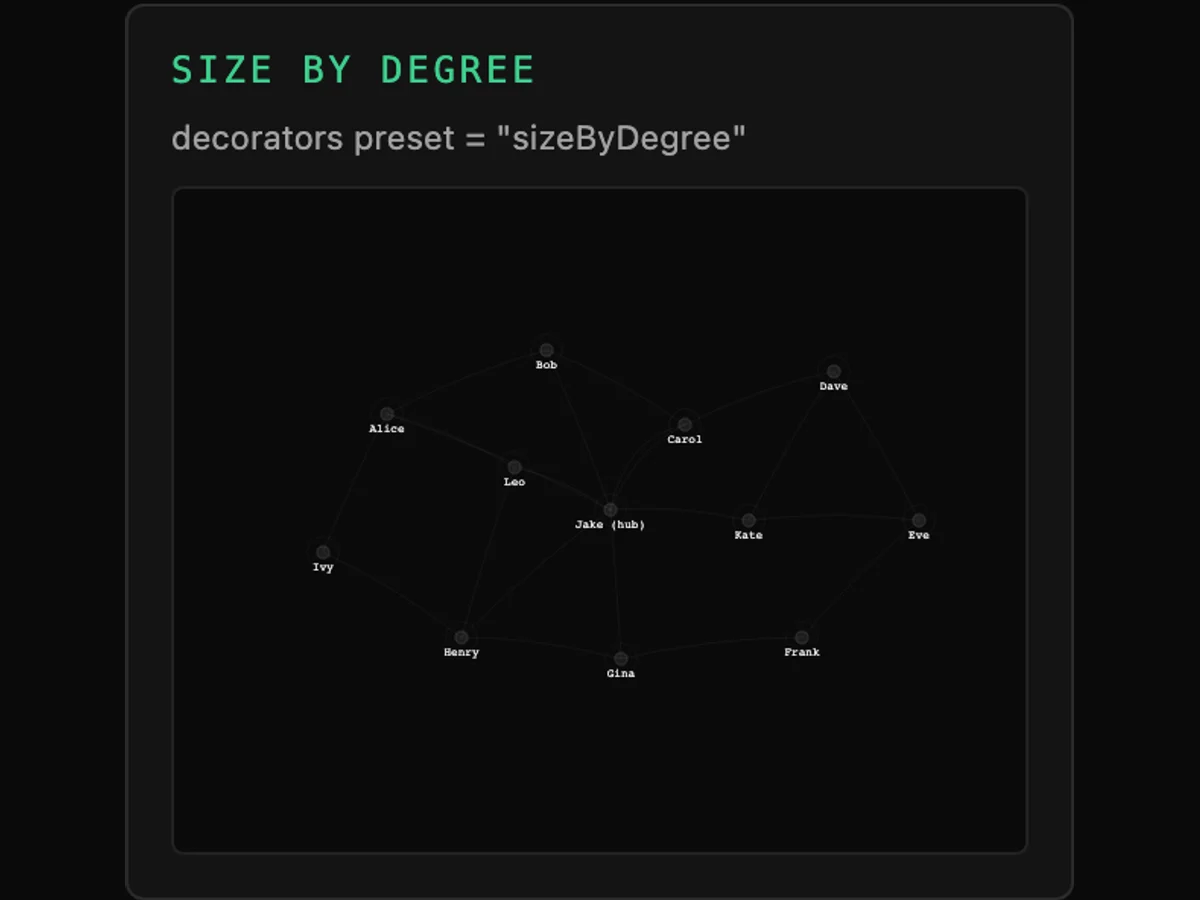
Analysis-driven styling
Run the algorithm, then style from the answer: styleBy maps a result straight onto size, colour or visibility with a 400ms transition. No server round trip, so the analyst can change the question without waiting.
Graph
· Cyber security
· Intelligence
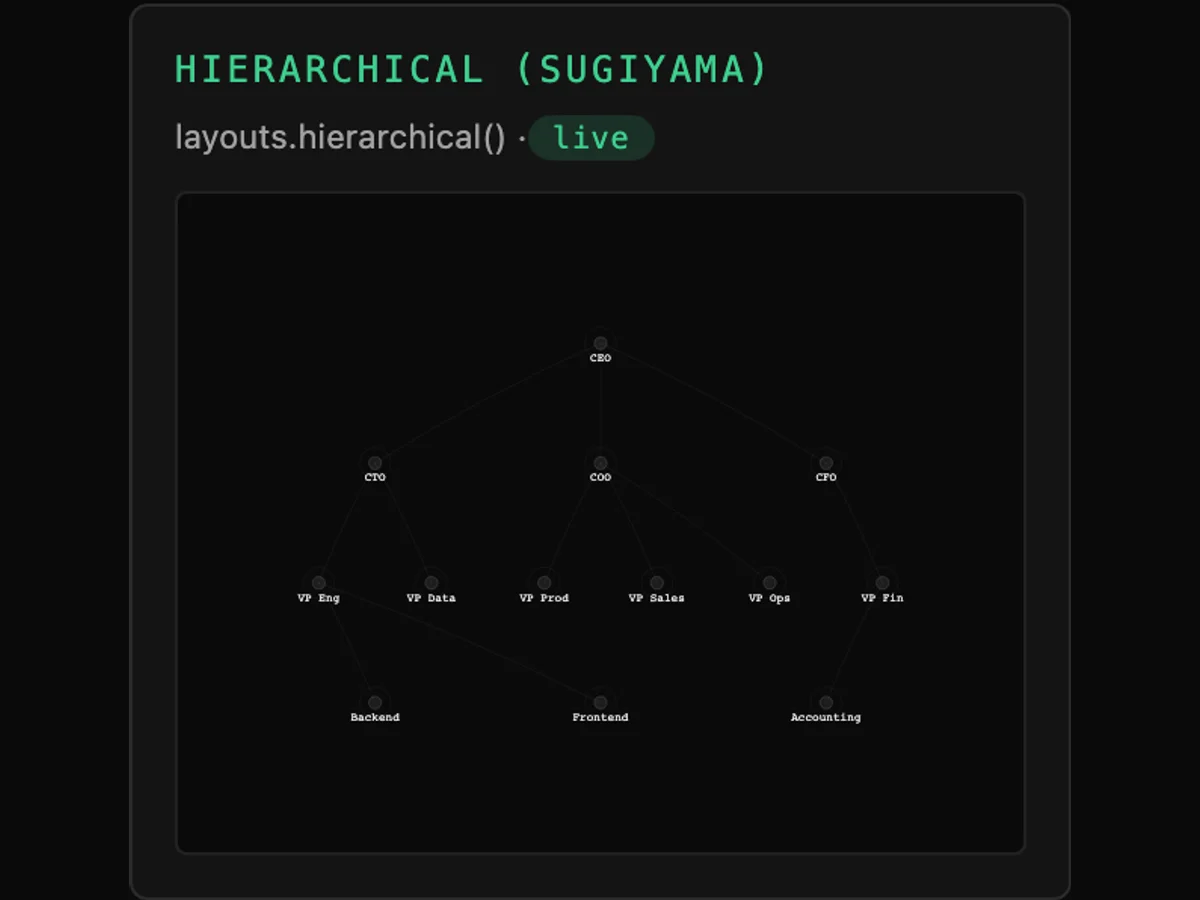
Structural layout on an unfamiliar network
Groups nodes by the role they play in the topology, so hubs sit with hubs and leaves with leaves. It is how you see the shape of a network you have never seen before.
Graph
· Intelligence
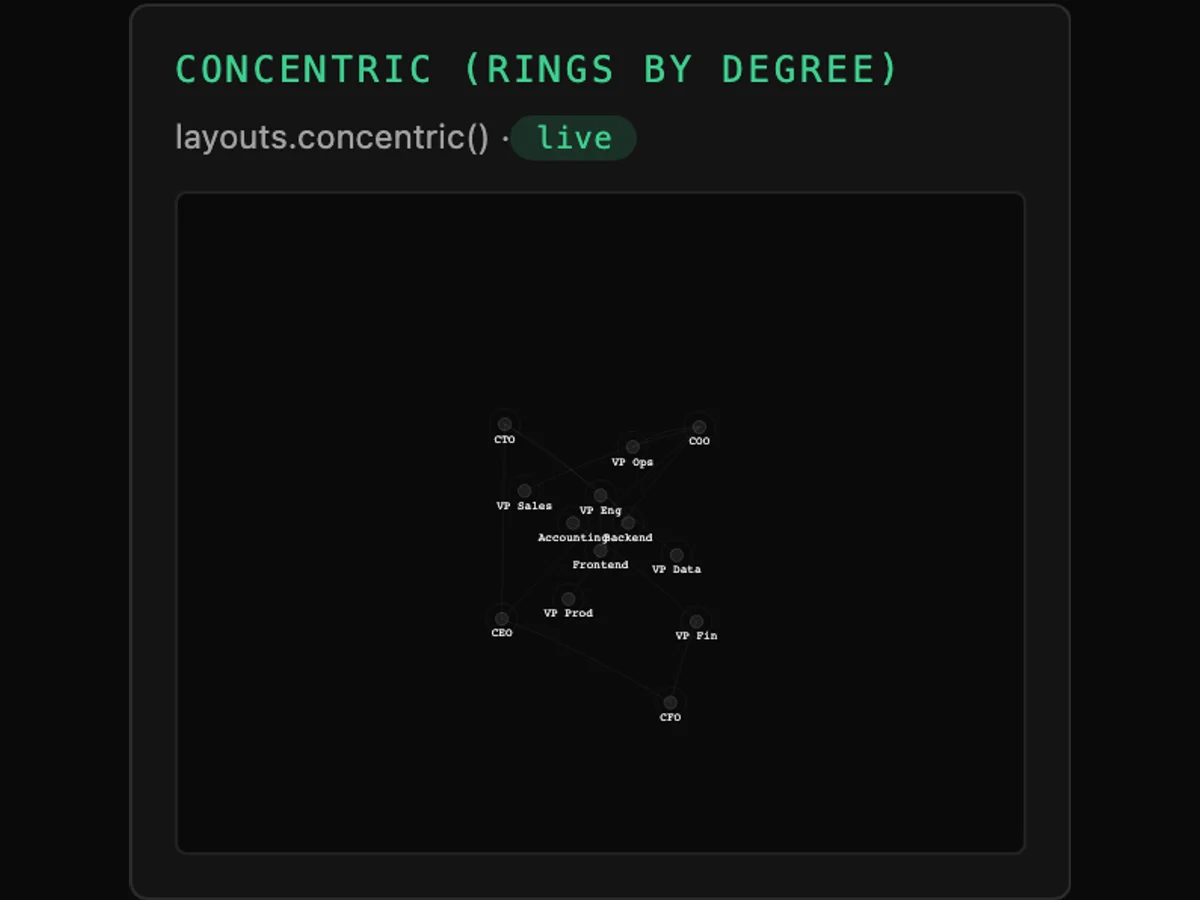
Lens layout
Magnifies around a focus node and compresses the rest, so context stays on screen while the detail is readable.
Graph
· Financial crime
· Cyber security
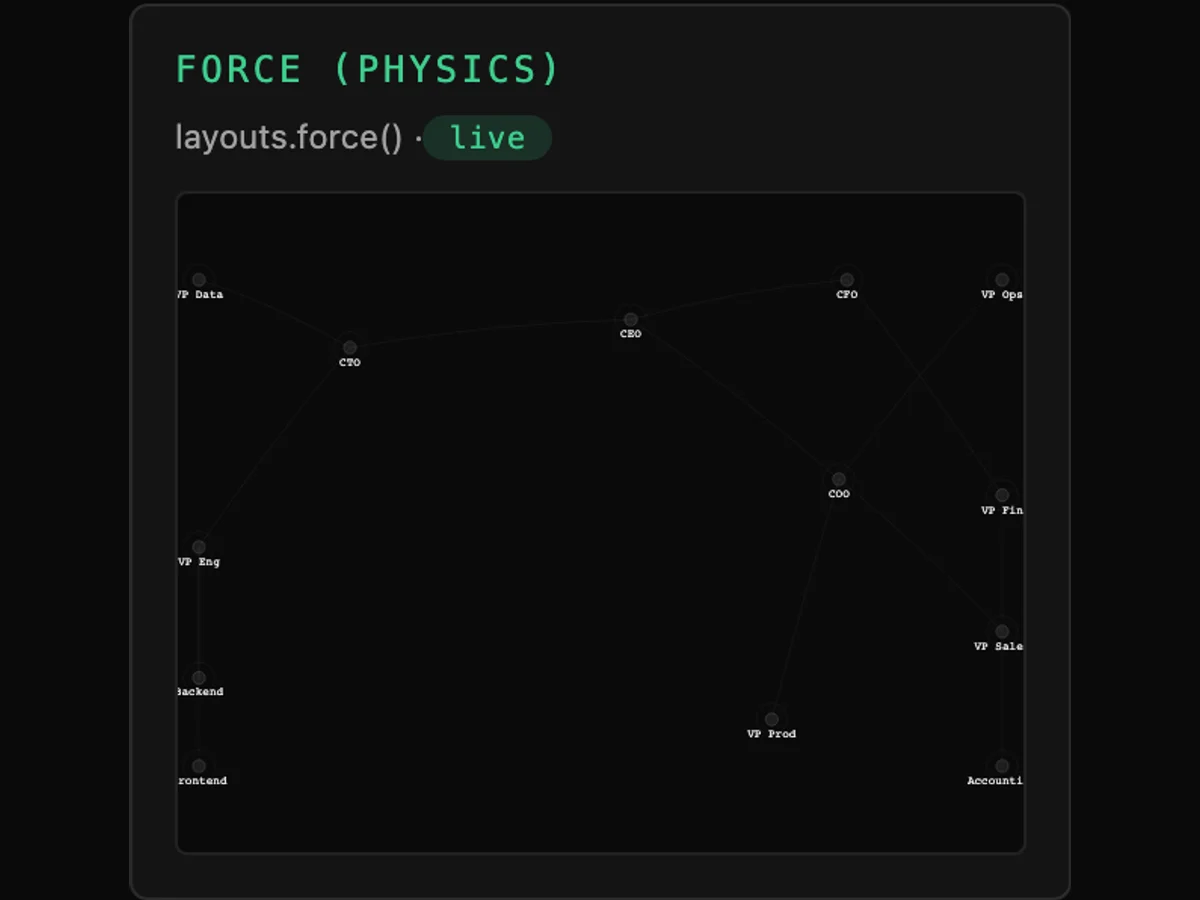
Tweak layout under a live feed
Re-runs the layout while keeping existing positions stable. When the data updates, the user's mental map survives it.
Graph
· Intelligence
Combos: group, expand, drill down
Collapse a set of entities into one node and open it again. The grouping is computed over your data rather than baked into it, so a different grouping is a different call and not a different dataset.
Graph
· Cyber security
Incremental updates
Nodes arrive on a slow feed; links animate in and the layout accommodates them. Beside it, the same feed with redraw instead of animate — which is visibly worse, and is the argument.
Graph
· Cyber security
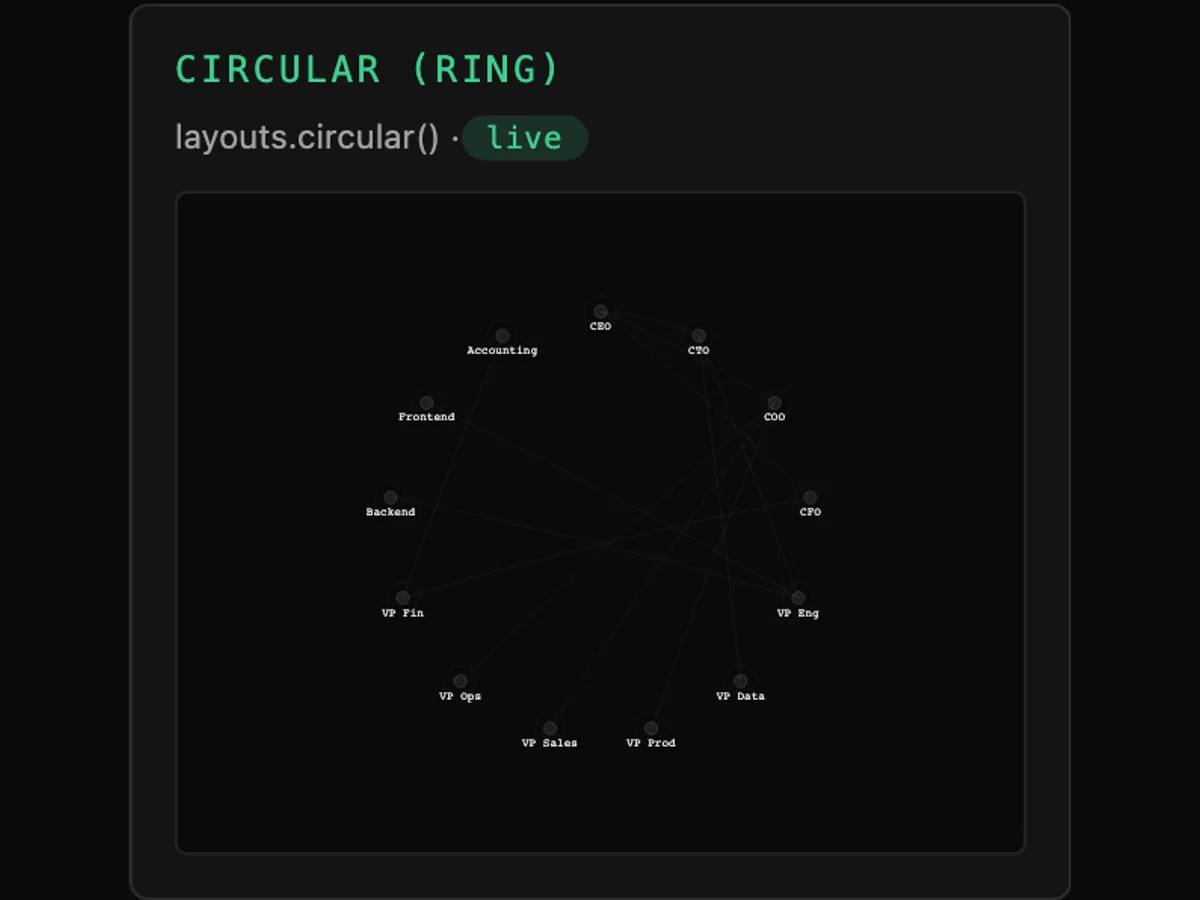
Renderer switch: SVG, Canvas, WebGL
One graph, three renderers, switched in place. The DOM element count falls from tens of thousands to one as you cross from SVG to Canvas, which makes the point faster than a paragraph.
Graph
· Life sciences
Metabolic pathway layout
A pathway is not a force-directed graph that happens to be biological. This layout exists because the work asked for it.
Graph
· Life sciences
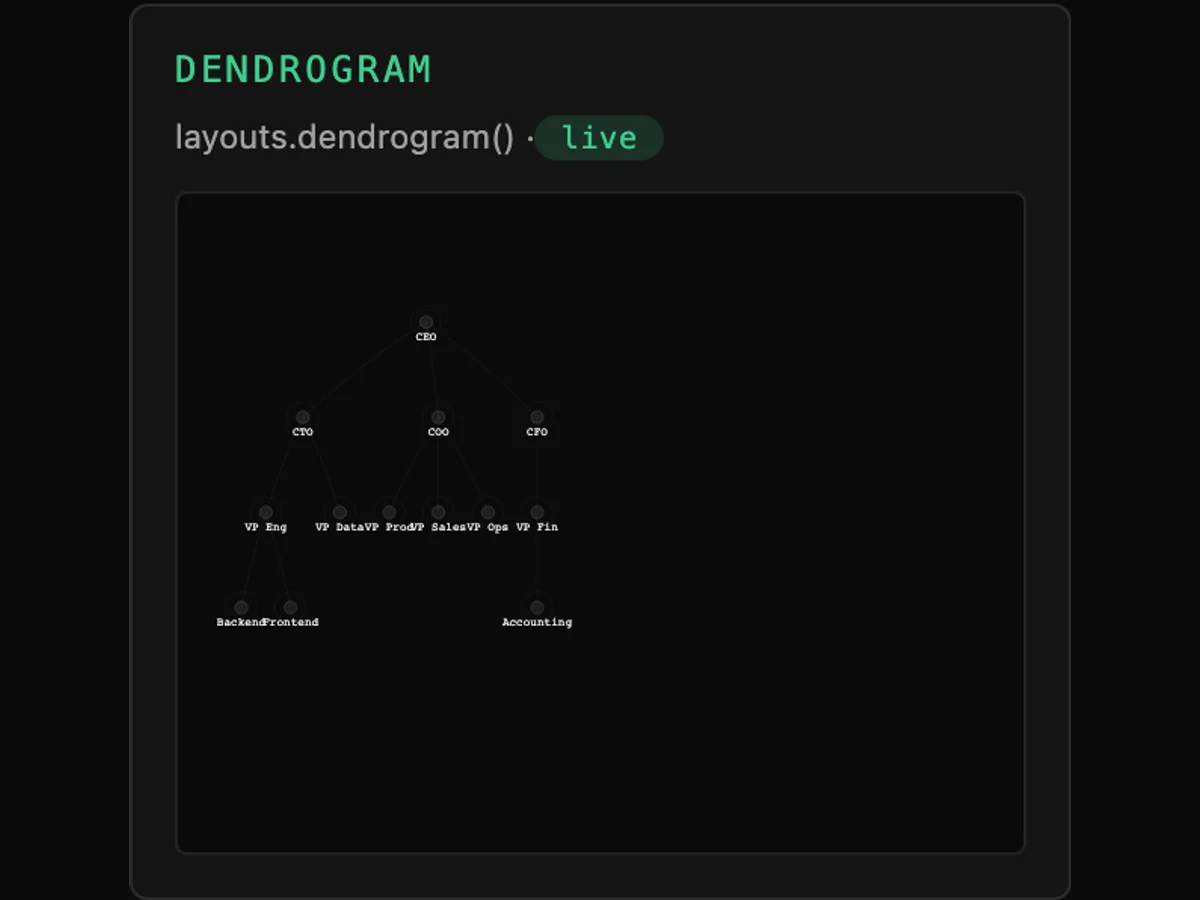
Kinship tree and dendrogram
Lineage where the relationship has a direction and a generation, drawn as a tree rather than settled by a force — and a dendrogram for hierarchical clustering results.
Charts
· Financial crime
· Supply chain
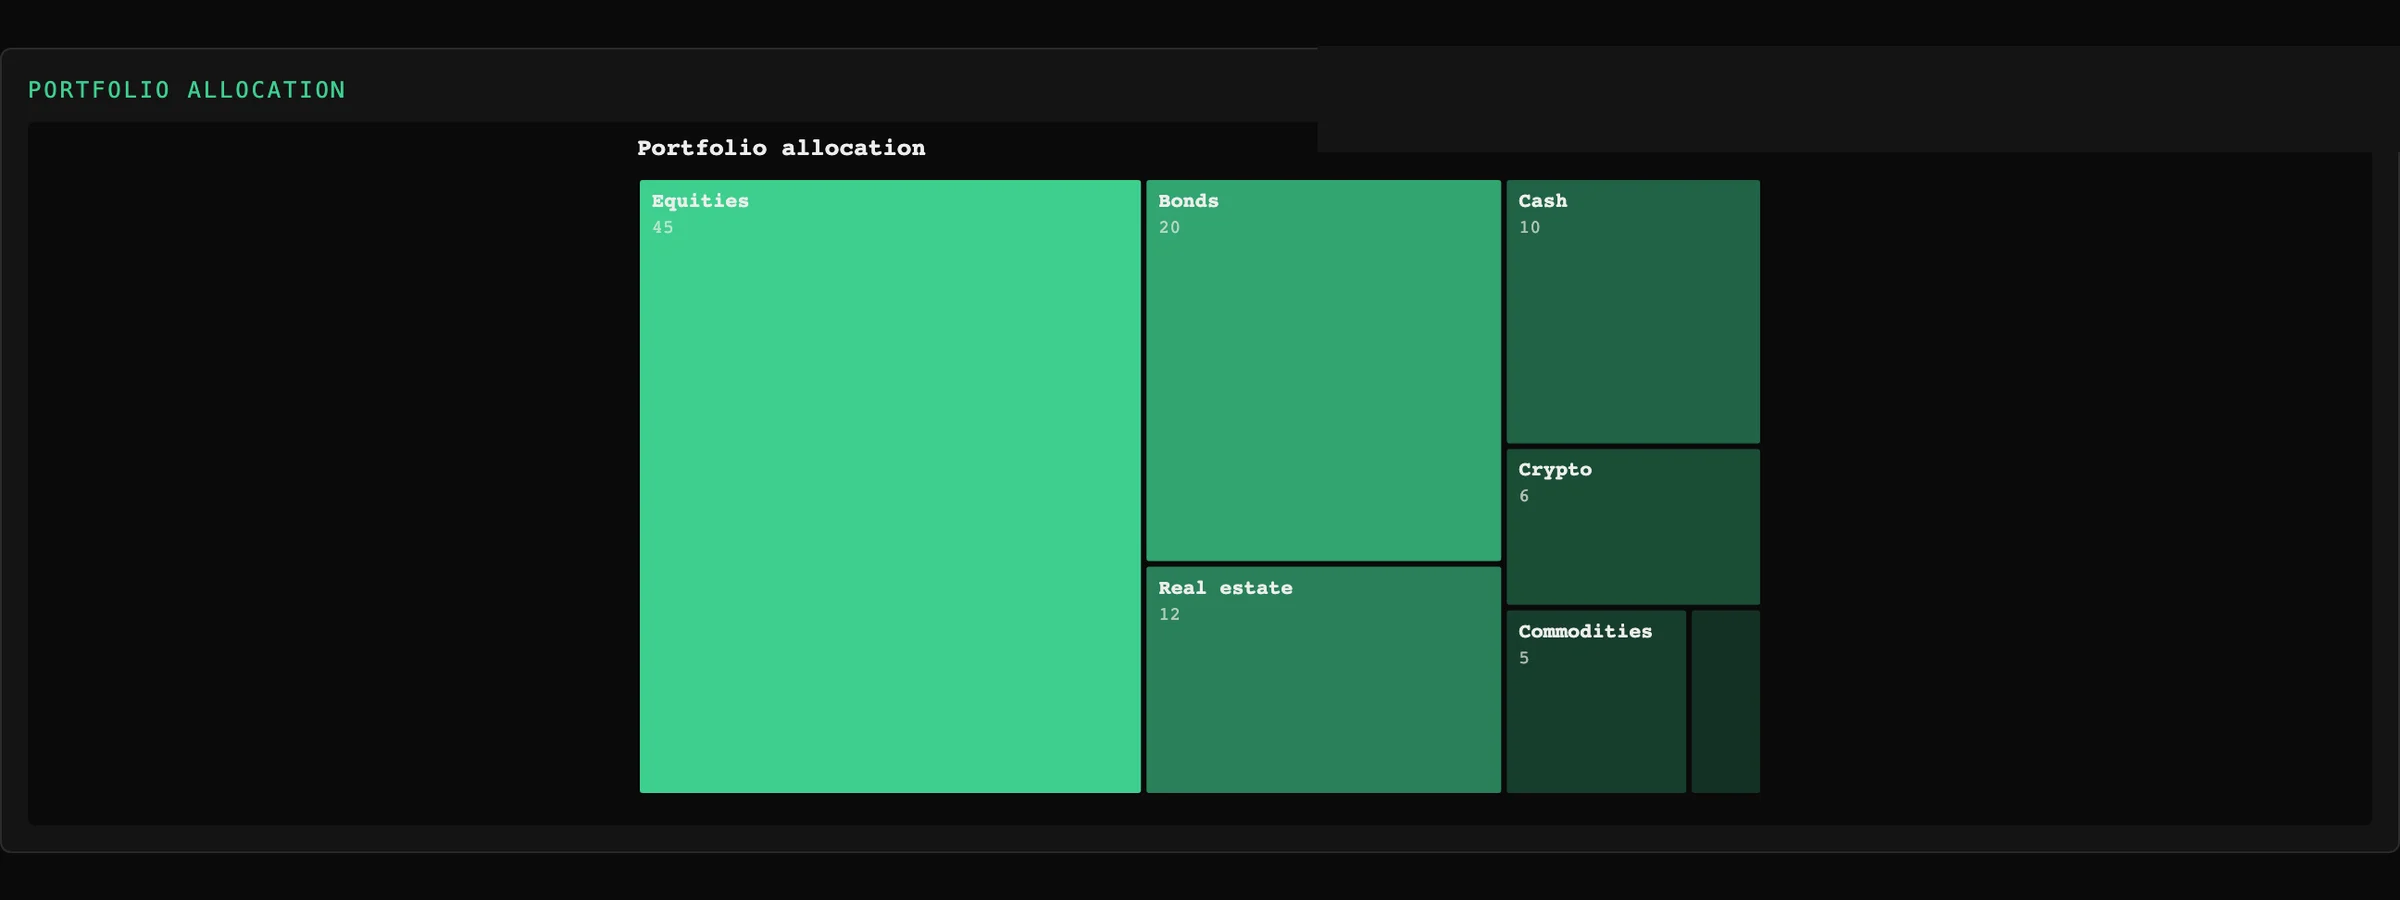
The chart wall: one dataset, many idioms
The same underlying figures drawn as twenty different chart types, each real, each reading the same data shape and taking the same options. Learn the grammar once.
Charts
· Financial crime
· Supply chain
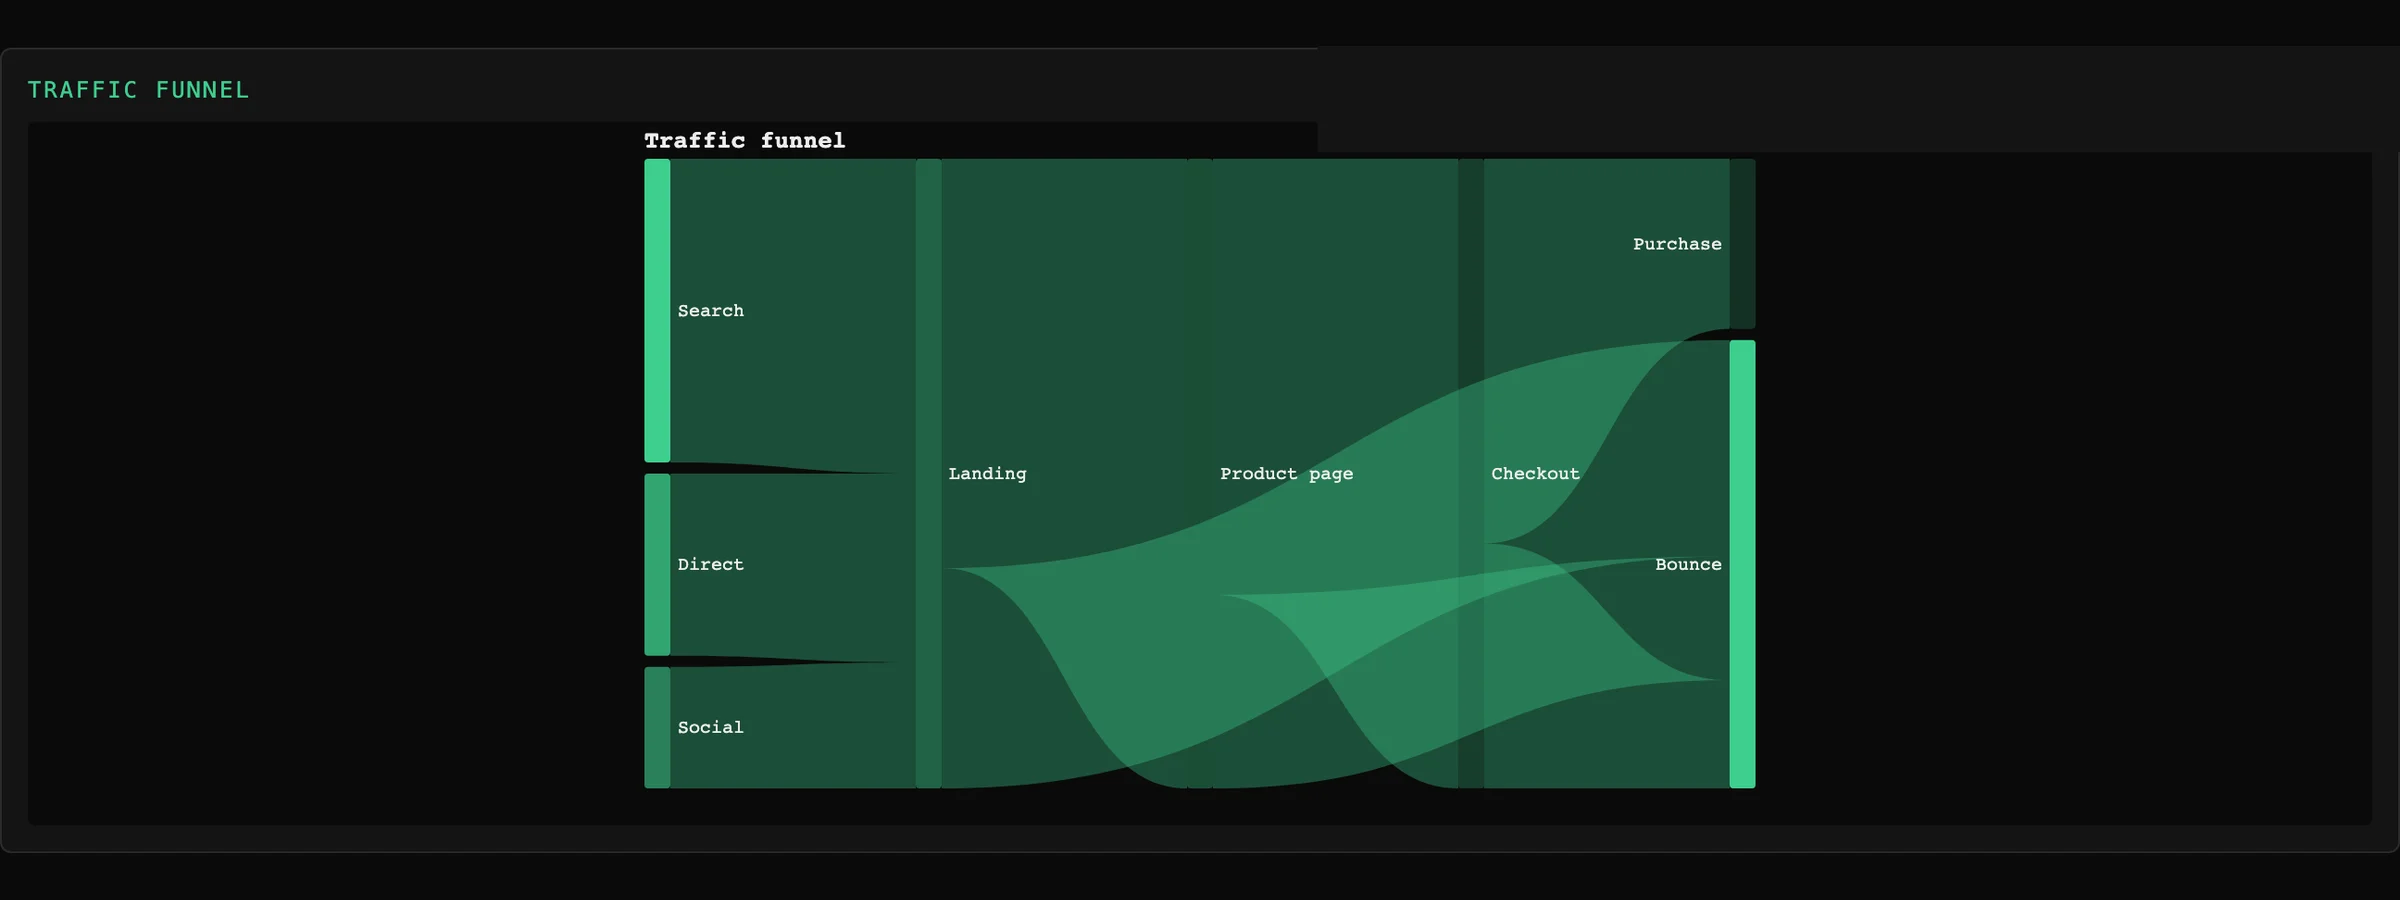
Sankey and chord flows
Where the volume went, and between whom. Flow charts that share a theme with the graph beside them.
Charts
· Financial crime
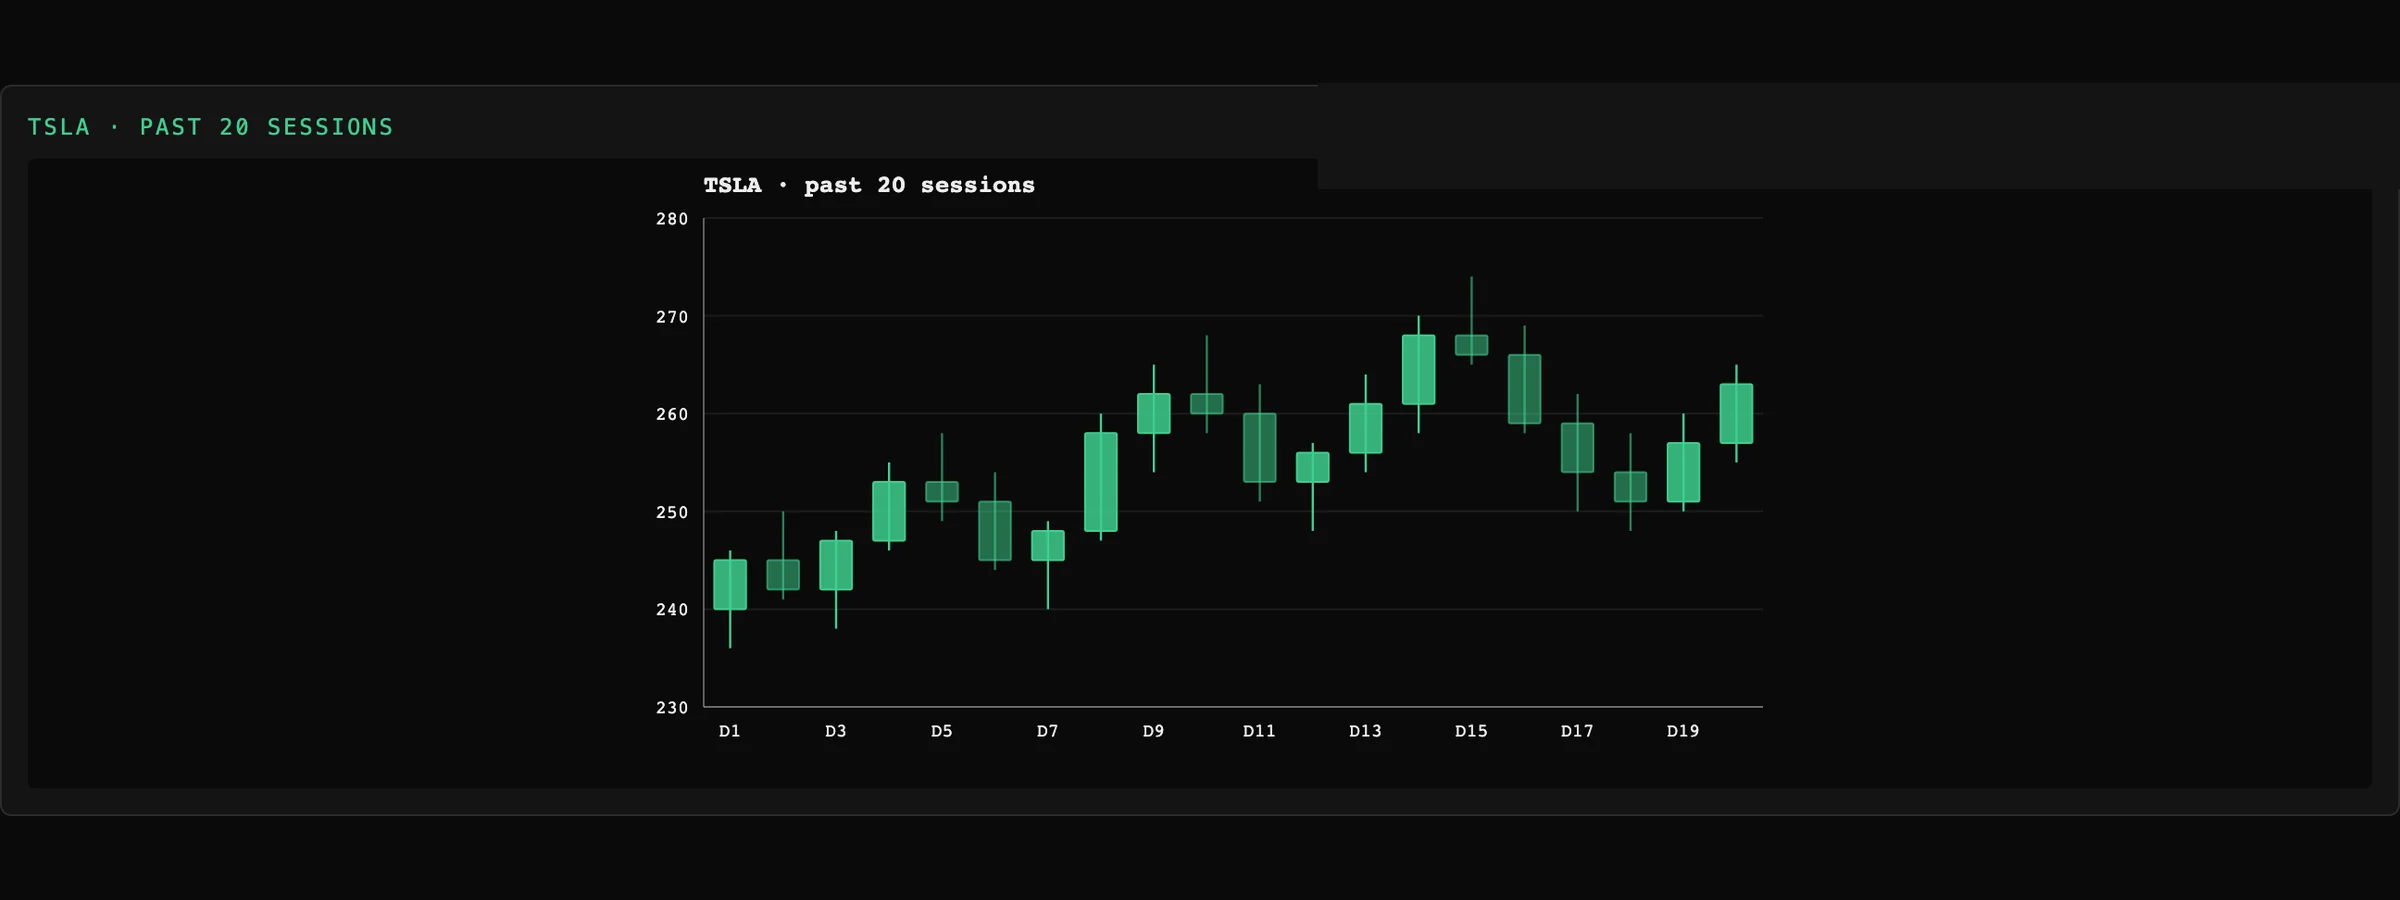
Candlestick and OHLC
Financial series drawn properly — bodies, wicks and a price scale — in the same package as the graph engine rather than as a second vendor's component.
Charts
· Supply chain
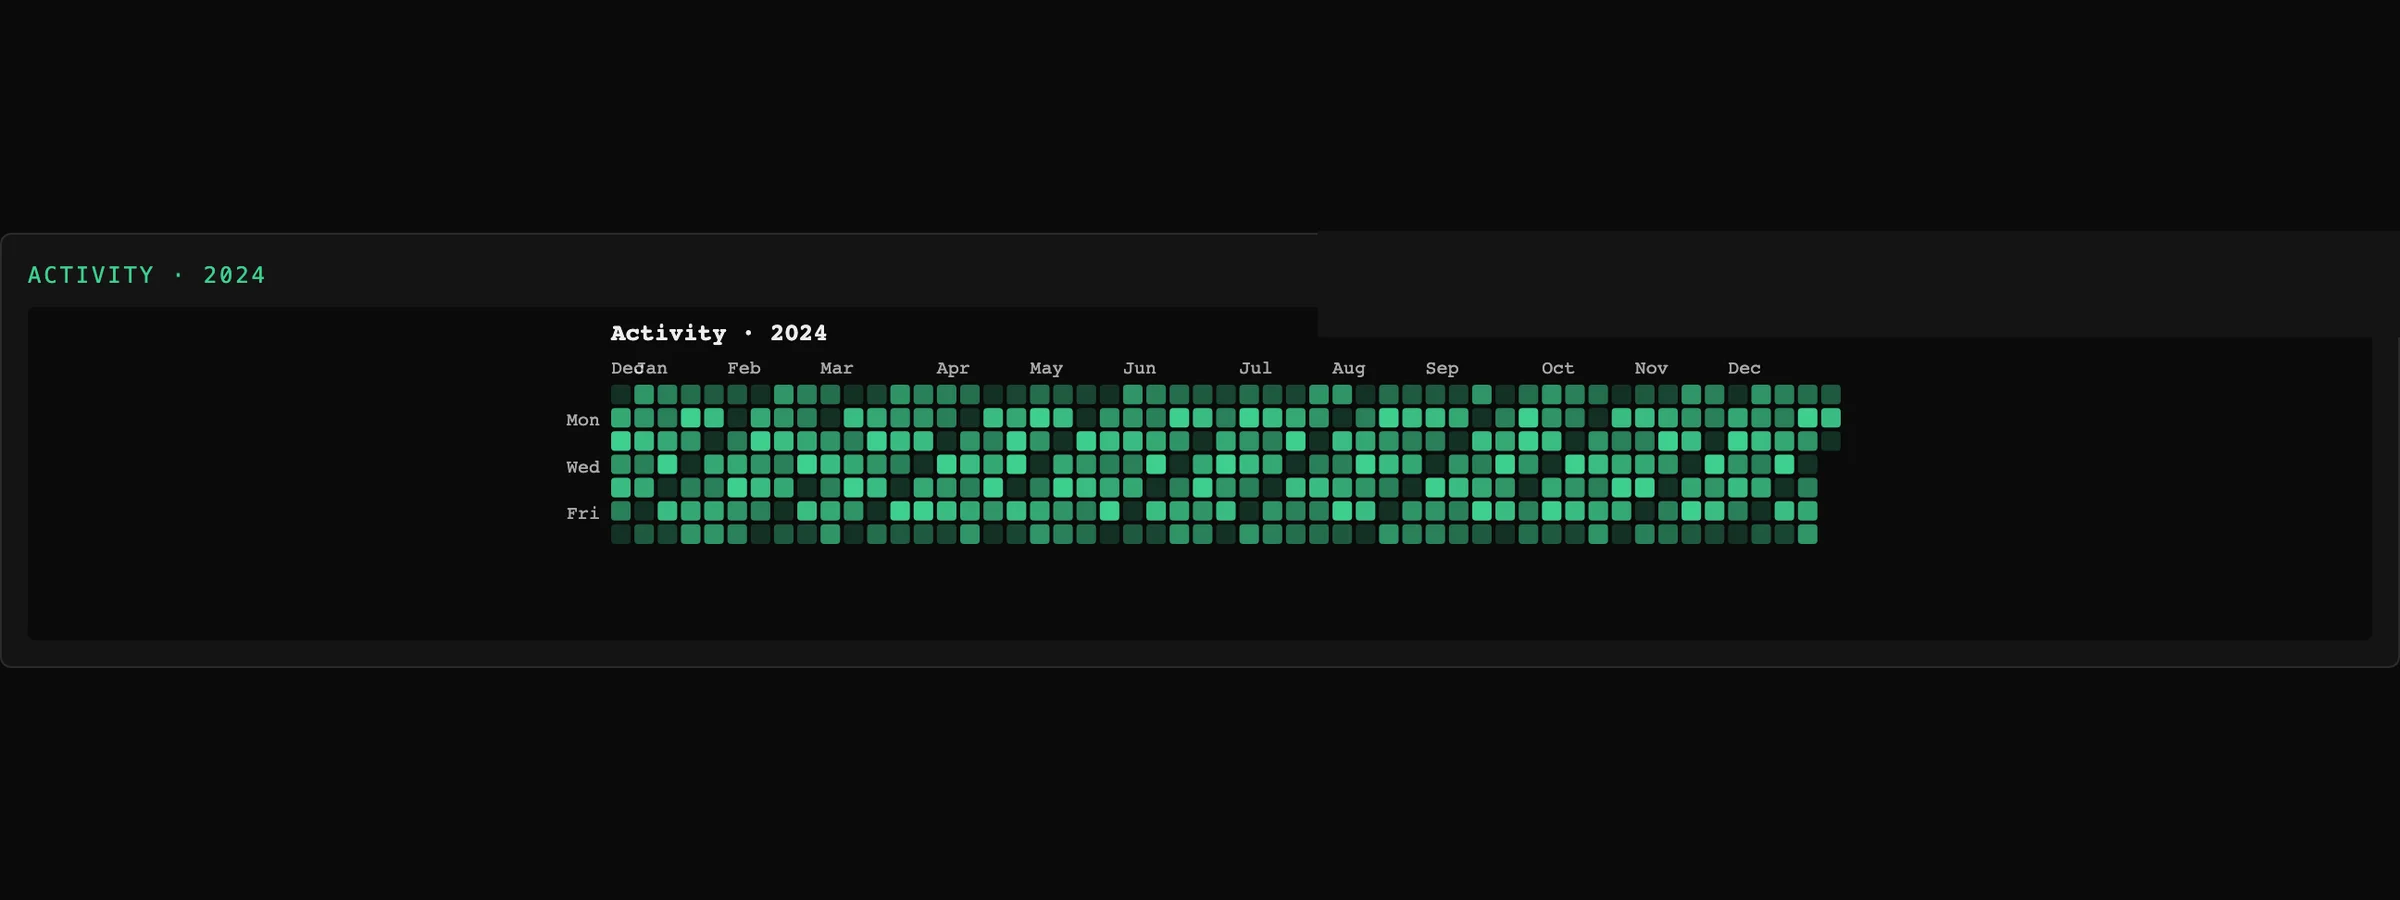
Small multiples across twelve regions
One chart per category on a shared scale, which is the honest way to compare twelve things and much better than twelve lines fighting over one axis.
Charts
· Financial crime
· Cyber security
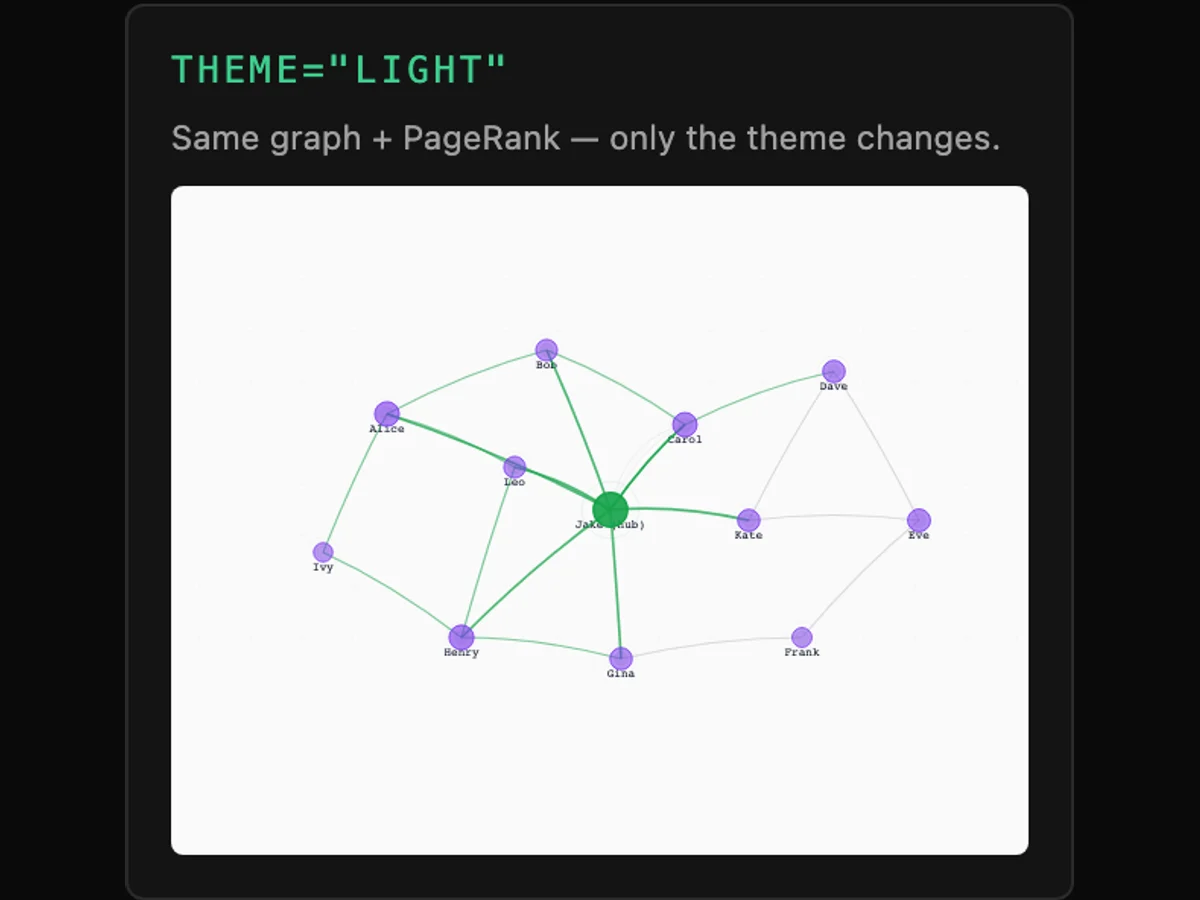
Theme tokens: your design system, not ours
Point the charts at your existing colour, spacing, radius and typography variables and they stop looking like a charting library. Light and dark are two token sets, not two code paths.
Timeline
· Intelligence
· Life sciences
Zoom from a century to a second
One continuous gesture across the whole range, with the detail level following it — aggregated bands when zoomed out, individual events with labels when zoomed in.
Timeline
· Financial crime
Multi-track: twelve accounts aligned in time
One track per entity, sharing an axis. An investigation of twelve accounts is twelve rows, and the sequence is the story.
Timeline
· Financial crime
· Intelligence
Playback across linked views
Step a cursor through time and watch the graph, the map and the grid follow it. This is how a sequence of transfers becomes a narrative.
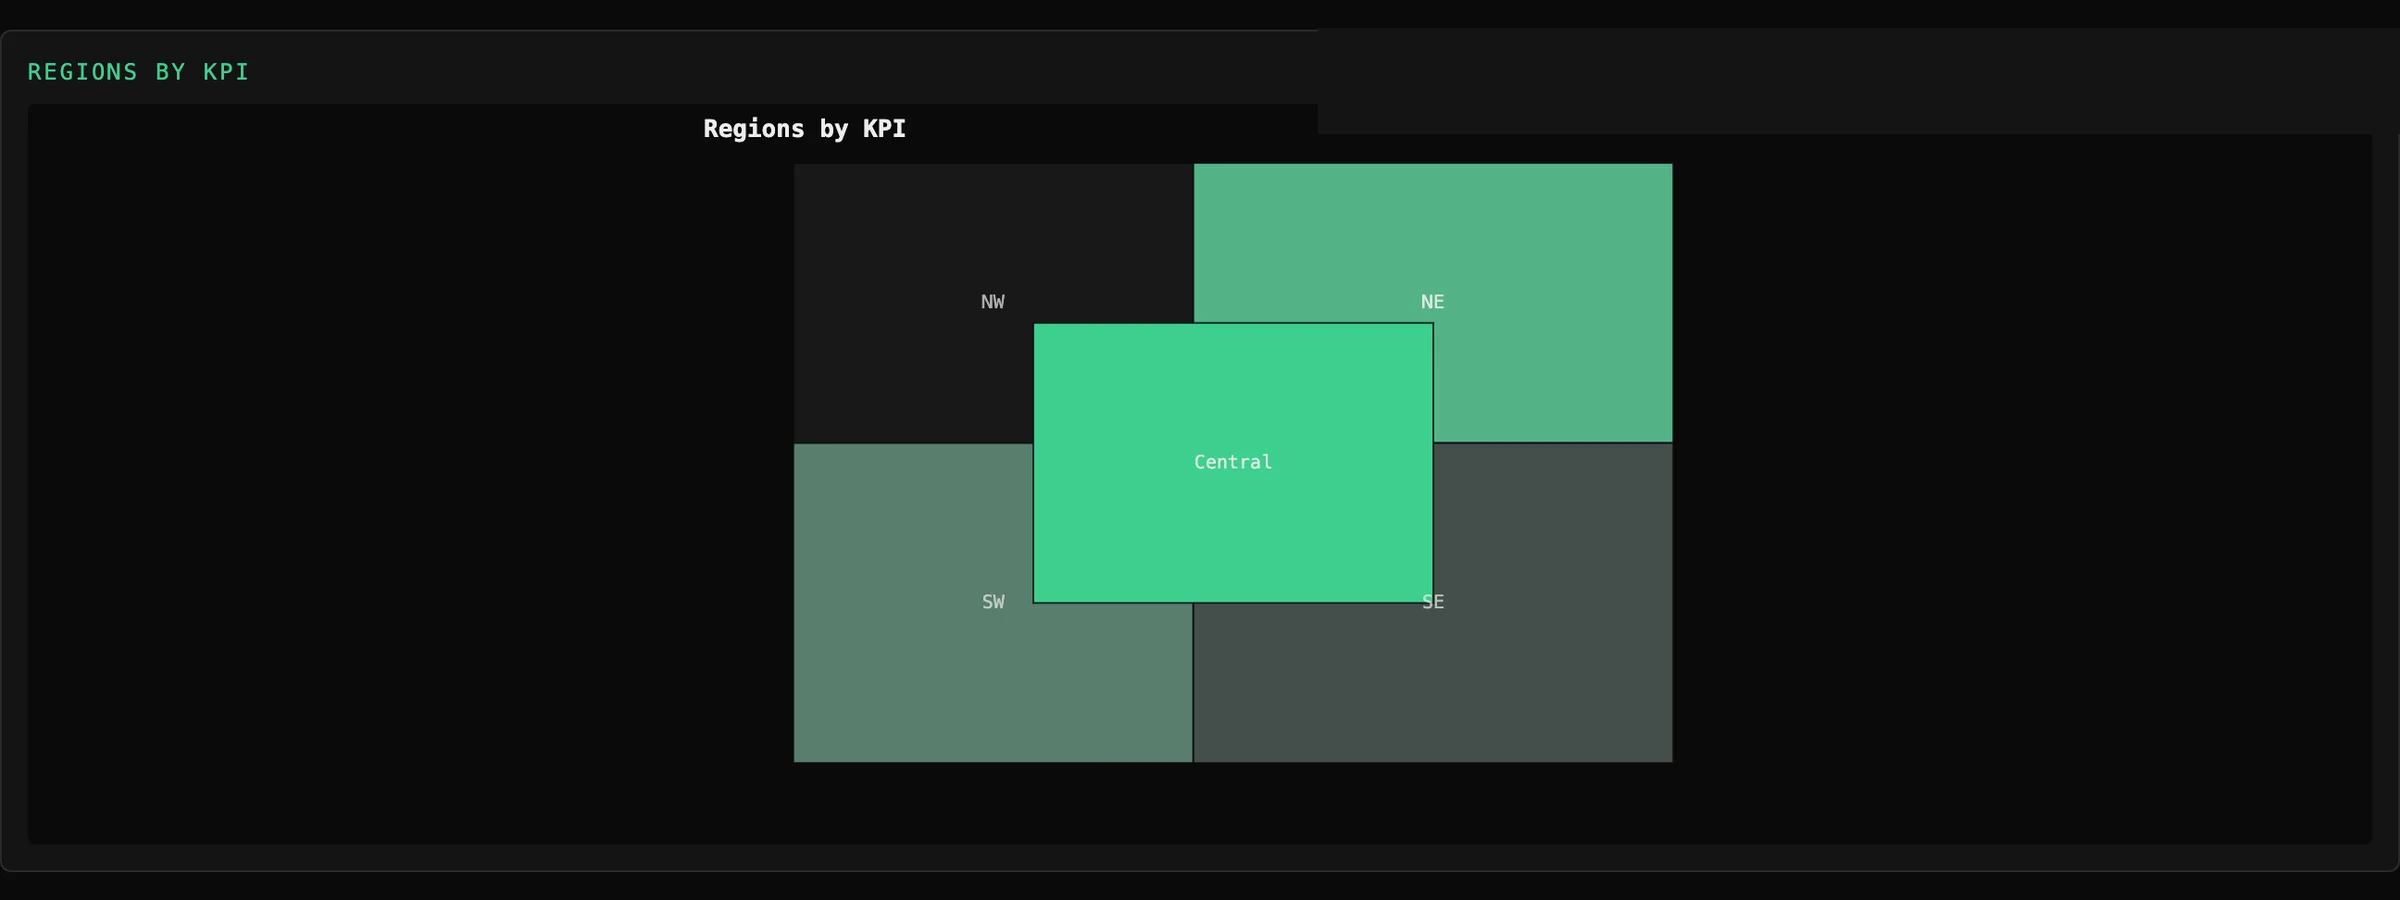
Maps
· Supply chain
Clustering by zoom
Points collapse into counts as you zoom out, so a dense port is one marker labelled 4,182 rather than 4,182 overlapping markers.
Maps
· Supply chain
Edge bundling on flows
Parallel routes grouped into visible corridors. Bundling runs in projected world space, so it stays correct at every zoom instead of re-bundling on each pan.
Maps
· Supply chain
· Intelligence
Tracked movement with trails
Interpolated strictly between known samples, with a trail behind. We do not invent a position beyond your data, because on a map an extrapolated position is a false claim about where something was.
Maps
· Intelligence
Offline tile pack, no internet
A vector basemap drawn from a tile pack shipped with the application. We wrote the protobuf reader, the tile decoder and the renderer, so a basemap adds no dependency and needs no tile server.
Grid
· Financial crime
· Cyber security
Linked selection: graph to grid
Click a node and the grid scrolls to its row. Filter the grid and the graph dims what the filter removed. There is no synchronising code because there is nothing to synchronise.
Grid
· Supply chain
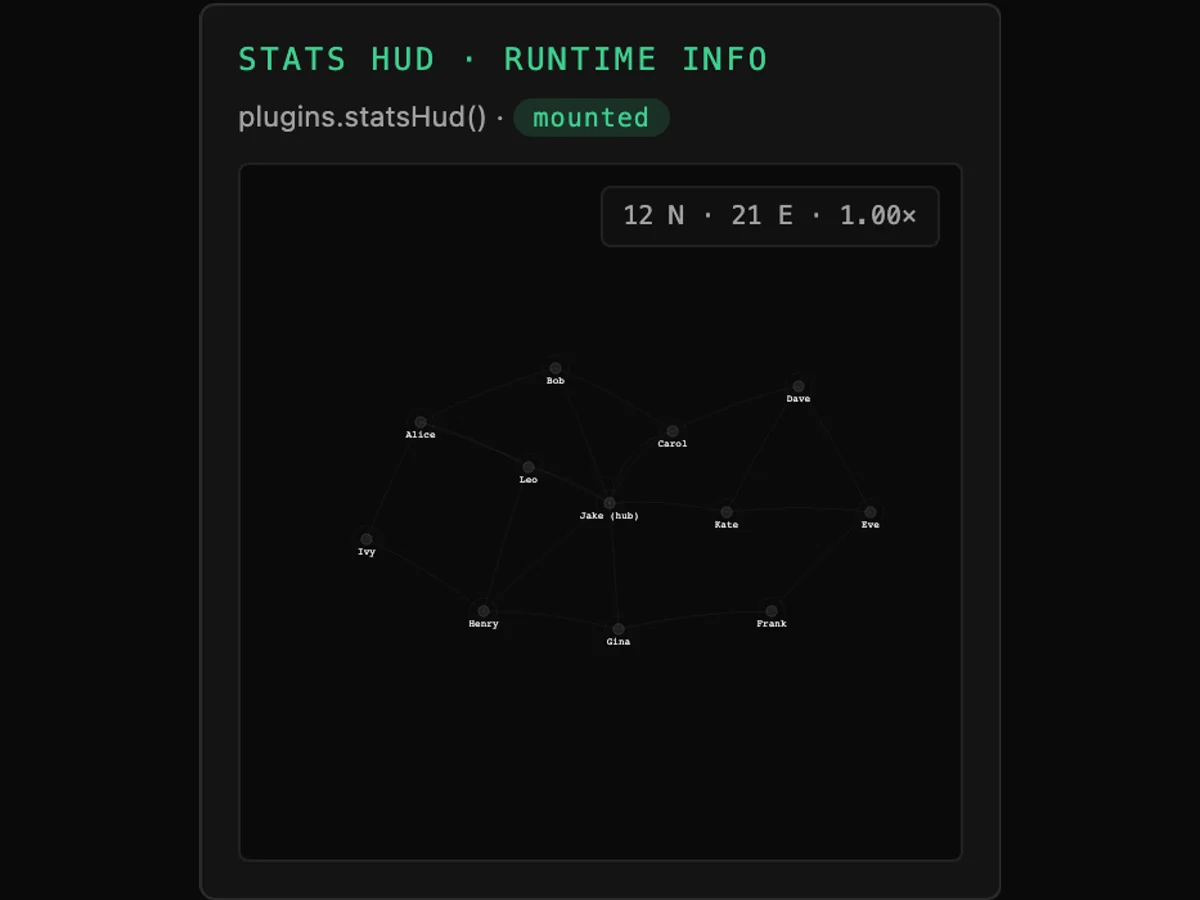
Grouping, pivot and in-cell sparklines
Row grouping with aggregation, multi-column sort, an advanced filter builder and sparklines in the cells — sharing a theme with the charts beside them.
Linked
· Intelligence
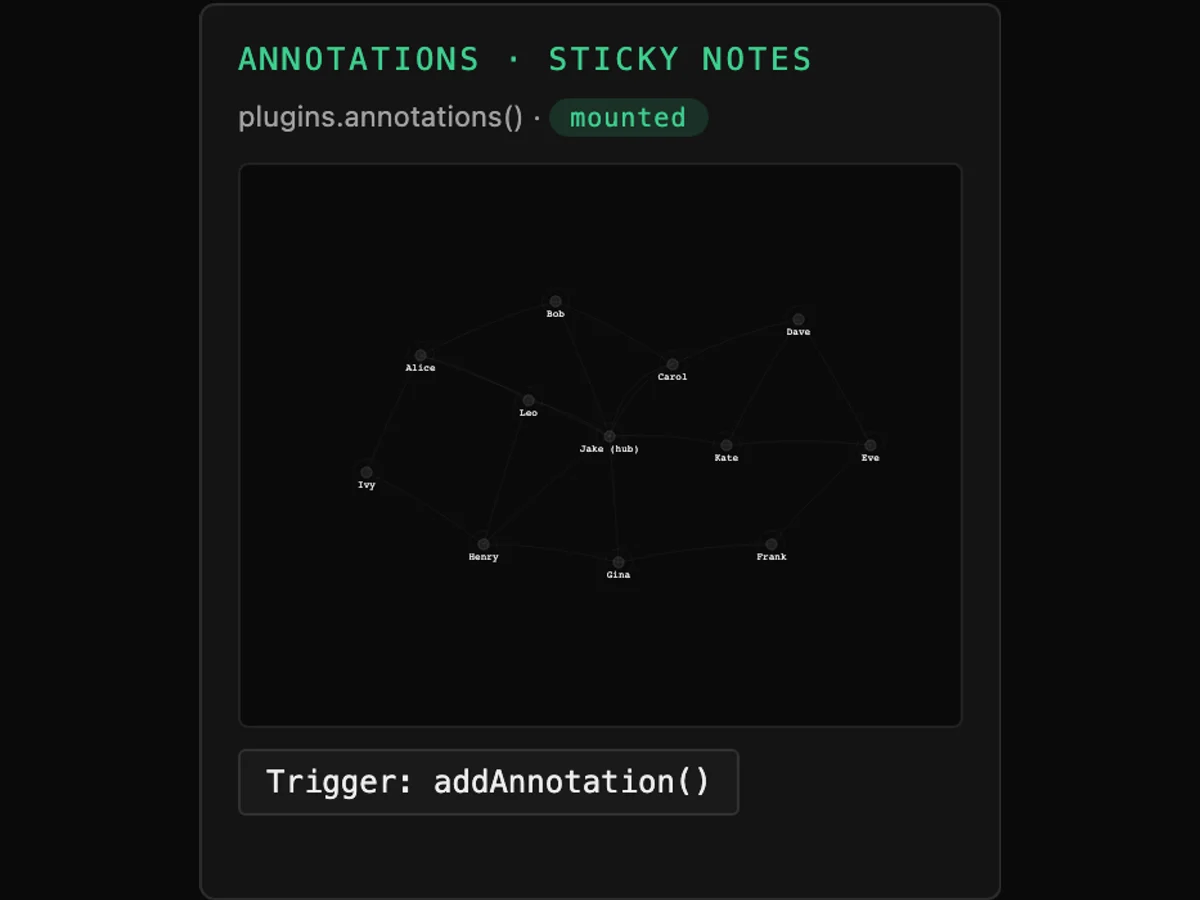
Annotations for a briefing product
Narrative annotation over the chart, then export to PNG, SVG or PDF. Vector export that is really vector, because a briefing pack is read at whatever size the reader chooses.
Each capture is from the library's own feature harness — one element per image, no mock-ups. The runnable version of each of these, with its source and an editable playground, ships with the documentation; until that is public we would rather show you a real capture and say what it is than embed a video and call it live.
The one to look at first.
One dataset, five views, linked
If you look at one thing on this page, this is it. Every other demo shows a capability; this one shows the argument. Four surfaces over the same synthetic payments network, sharing a selection model — click once and all four follow, because there is only one selection.
Why the dataset repeats
The same synthetic payments network runs through the landing page, the product pages and these demos. A payments network is legitimately all five things — a graph, a sequence, a geography, a table and a set of charts — and a visitor who recognises it on the fourth page is learning the product rather than looking at a new picture.