Tessera Viz
PX-02
Surface 02
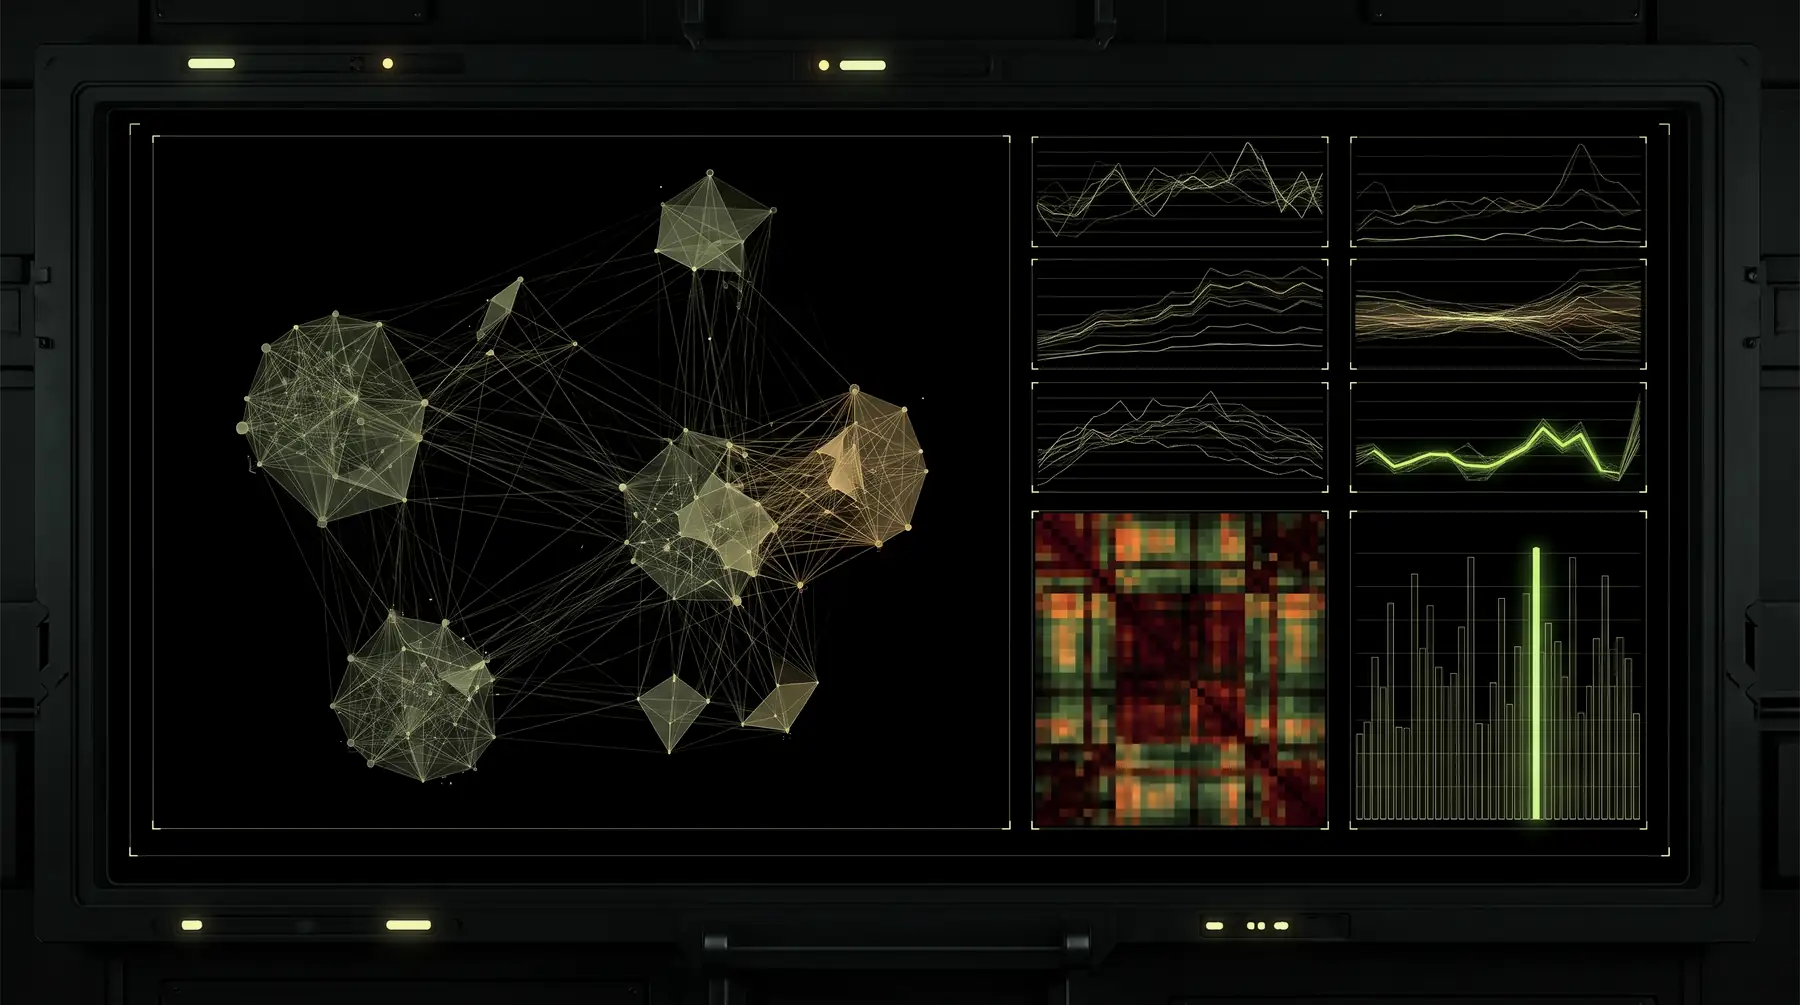
81 chart types. One grammar. One theme.
Every chart reads the same data shape, takes the same options and obeys the same theme tokens. Swap bar for waterfall and the chart changes; nothing else does.
The catalogue, all eighty-one.
Comparison
Bar · horizontal bar · divergent bar · stacked area · butterfly · dumbbell · dot plot · lollipop · bullet · marimekko · mosaic · waterfall · pyramid · chevron.
Trend over time
Line · area · spline · step · sparkline · stream graph · ridge · bump · slope · connected scatter · calendar · punchcard · stripes · cycle · spiral · barcode.
Distribution
Histogram · box plot · violin · beeswarm · density · ridge · Q–Q plot · percentile · error bar · range · contour.
Part to whole
Pie · donut · semi-donut · rose · polar area · waffle · pictogram · treemap · sunburst · icicle · bubble pack · funnel.
Correlation
Scatter · bubble · hexbin · heat map · matrix · quadrant · parallel coordinates · radar · ternary.
Flow and relationship
Sankey · alluvial · chord · arc · hive · dendrogram · bracket · fan · ribbon.
Geospatial
Choropleth · vector field.
Financial
Candlestick · OHLC · Kagi · Renko.
Indicator
Gauge · progress ring · radial bar · KPI card · KPI grid.
Composition
Combo · small multiples · timeline.
Learn it once.
The chart type is a function
The options are the same options. There is no per-chart configuration dialect to relearn on your fourteenth chart.
A theme is a set of tokens
Not a stylesheet per chart. Point the charts at your existing colour, spacing, radius, typography and motion variables and they stop looking like a charting library.
Light and dark
Two token sets, not two code paths. Contrast ratios are checked in our build, so a theme that fails WCAG AA fails the build.
Twelve charts are sometimes one chart
Small multiples render one chart per category on a shared scale, which is the honest way to compare twelve regions and much better than twelve lines fighting over one axis. Combo puts several series types on shared axes when they genuinely belong together.
Limits.
Presentation, not analysis
No statistical modelling and no forecasting. Compute the numbers, and hand us the numbers.
Very large scatter plots
Beyond about 100,000 points, bin them — use hexbin or density. We will render 100,000 points; your users cannot see them.