Tessera Viz
PX-02
Surface 01
Graph visualization built for investigation, not decoration.
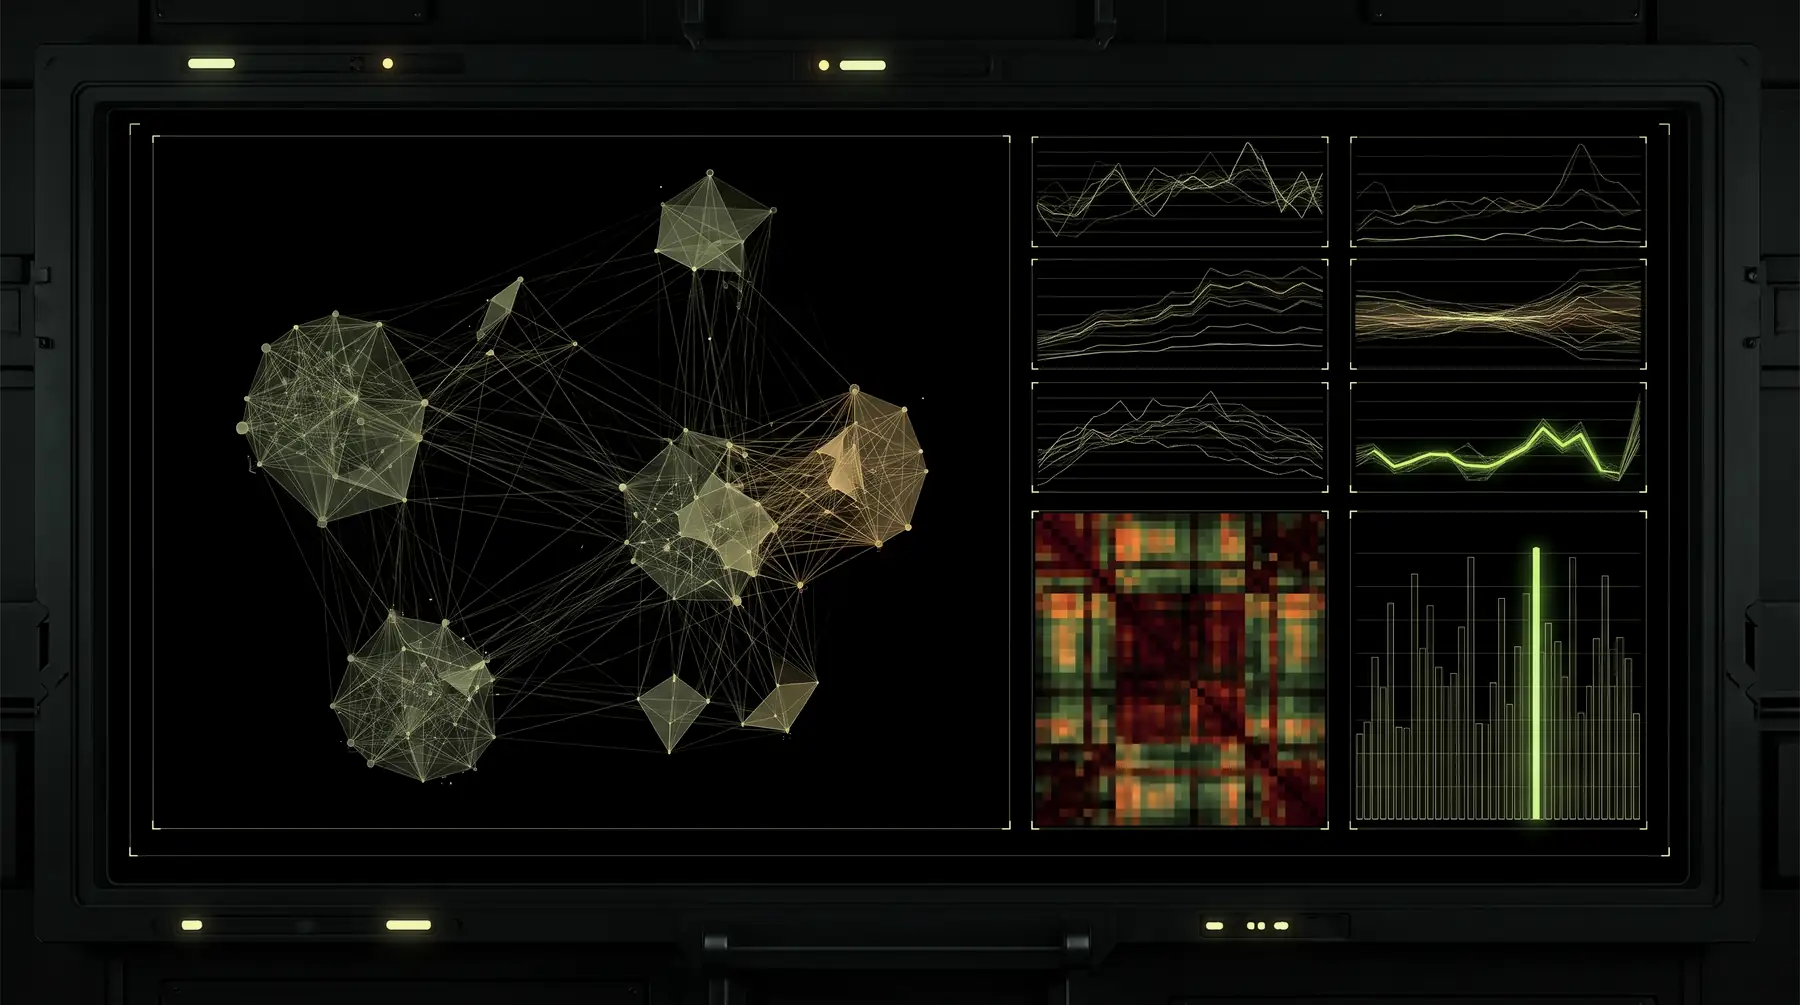
Lay out a hundred nodes or a hundred thousand. Run 26 graph algorithms over them. Drive colour, size and visibility from the results — in the browser, with no server round trip.
Twenty layouts, and the three investigators ask for by behaviour.
The twenty
Force-directed · Circular · Grid · Hierarchical · Concentric · Radial tree · Dendrogram · Sequential · Structural · Lens · Tweak · Cola · fCoSE · Sugiyama · Metabolic pathway · Kinship tree · Random · Force 3D · Sphere · Layered Z.
Structural
Groups nodes by the role they play in the topology, so hubs sit with hubs and leaves with leaves. It is how you see the shape of a network you have never seen before.
Lens
Magnifies around a focus node and compresses the rest, so context stays on screen while the detail is readable.
Tweak
Re-runs a layout while keeping existing positions stable. When the data updates, the user's mental map survives it.
Twenty-six algorithms, client-side.
Centrality
PageRank · Personalised PageRank · Betweenness · Eigenvector.
Paths and flow
Dijkstra · A* · Floyd–Warshall · Ford–Fulkerson · Min-cut.
Structure
Louvain · Label propagation · Connected components · Tarjan SCC · Spectral · Hierarchical clustering · K-means.
Trees
Kruskal · Prim.
Learning
k-NN · k-NN classifier · Logistic regression · SVM · Random forest · Neural forward pass · RNN · Attention.
Run the algorithm. Style from the answer.
The usual pattern
Run the analysis on a server, write the results back onto your nodes, re-fetch, re-render. Every question costs a round trip, so the user asks fewer of them.
What happens instead
The algorithms run in the browser over the graph you already have, and the result maps straight onto a visual channel — size by betweenness, colour by community. Nodes that broker between clusters get bigger; clusters get colours.
Why the transition matters
The re-style animates rather than redrawing, so the analytical change is legible. Watching a network re-colour is what tells you what the algorithm found.
Interaction, and the visual vocabulary.
Interaction
Click, hover, multi-select, box-select, free-hand lasso, drag-to-reposition, pan, zoom, zoom-to-fit, keyboard navigation with a visible focus ring, context menus, and an undo/redo history.
Visual vocabulary
Node shapes, halos, donut rings, glyphs, badges, font icons, images, labels with collision-aware placement, arrow styles, curved and bundled links, edge labels, and per-element styling from your own data.
Combos
Group nodes into a single combo node, expand and collapse, and drill down. The combo is computed over your data rather than baked into it, so a different grouping is a different call and not a different dataset.
From a hundred to a hundred thousand.
Nodes | Renderer | What you get |
|---|---|---|
Under 2,000 | SVG | A DOM element per node — CSS, the inspector and screen readers. |
2,000 – 20,000 | Canvas | One element. Full styling, 60fps interaction. |
20,000 – 100,000+ | WebGL | GPU-drawn, with the same geometry and styling. |
← Swipe for the rest of the table →
Data changes. The view keeps up.
Incremental updates
Add nodes, remove nodes, update properties, and the chart animates to the new state instead of redrawing it. Links slide, positions ease, and what is already on screen stays where the user left it.
Getting data in
Adapters for Neo4j, Gremlin/TinkerPop, TigerGraph, GraphQL, Elasticsearch, CSV, JSON, Graphology, streaming sources and any REST API. Formats: DOT, Mermaid, GraphML and GEXF, with detection of which it has been handed.
Identity, normalised
Which is where these integrations actually go wrong — an elementId against a deprecated numeric id, a vertex id colliding across types, a type envelope. The adapter handles it, so your merge logic does not quietly join two different nodes.
One selection, four views
Select nodes here and the timeline highlights the events they took part in, the map highlights their locations and the grid scrolls to their rows.
Limits.
Orthogonal link routing
An Enterprise package, not in Community.
GPU force layout
Also Enterprise. The Community force layout is CPU, Barnes–Hut accelerated.
Above ~250,000 nodes
Aggregate before rendering. We provide the clustering to do it; we do not pretend the screen has a million useful pixels.